Figures & data
Figure 1 Study design for HER2 testing by IHC, QuantStudio 3D dPCR, and FISH.
Abbreviations: HER2, human epidermal growth factor receptor 2; IHC, immunohistochemistry; dPCR, digital PCR; FISH, fluorescence in situ hybridization; FFPE, formalin-fixed paraffin-embedded.
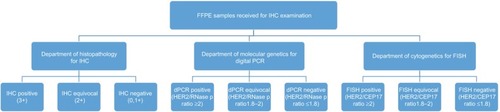
Figure 2 Comparison of processing time for FISH and dPCR.
Abbreviations: FISH, fluorescence in situ hybridization; dPCR, digital PCR; FFPE, formalin-fixed paraffin-embedded.
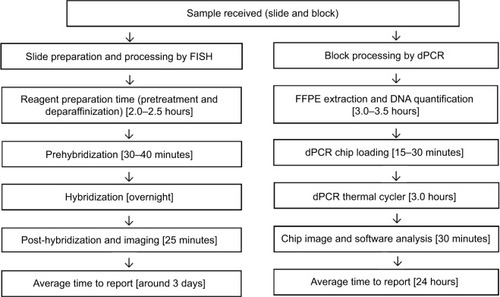
Table 1 Results of QuantStudio 3D dPCR with respect to IHC data
Figure 3 Distribution of HER2 dPCR results according to HER2 IHC data.
Note: The two horizontal lines in the graph indicate PCR equivocal range of 1.8–2.0.
Abbreviations: HER2, human epidermal growth factor receptor 2; dPCR, digital PCR; IHC, immunohistochemistry.
Abbreviations: HER2, human epidermal growth factor receptor 2; dPCR, digital PCR; IHC, immunohistochemistry.
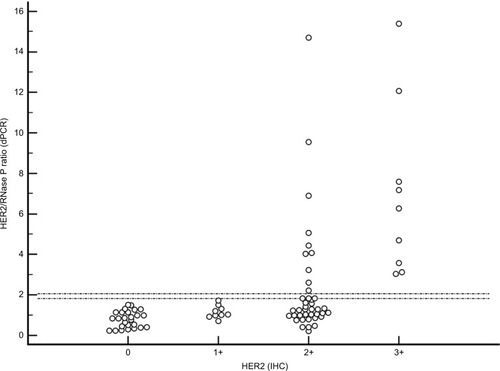
Table 2 HER2 distribution by IHC and dPCR
Figure 4 Correlation of values obtained by FISH HER2/CEP17 ratio and dPCR HER2/RNase P ratio in 76 samples.
Note: The two methods showed high Pearson correlation (r=0.925, p<0.001).
Abbreviations: FISH, fluorescence in situ hybridization; HER2, human epidermal growth factor receptor 2; dPCR, digital PCR.
Abbreviations: FISH, fluorescence in situ hybridization; HER2, human epidermal growth factor receptor 2; dPCR, digital PCR.
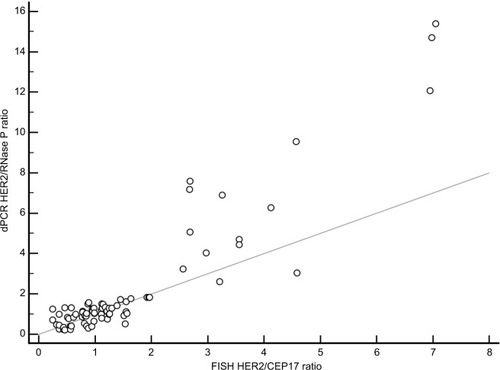
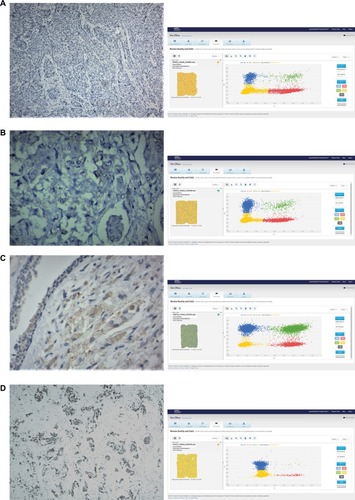
Figure 5 HER2 expression levels were evaluated by IHC and dPCR in FFPE tissue.
Notes: (A) IHC scoring negative 0 (negative) with dPCR ratio of 0.40 (negative); (B) IHC scoring negative 1+ (negative) with dPCR ratio of 1.00 (negative); (C) IHC scoring 2+ (equivocal) with dPCR ratio of 1.82 (equivocal); and (D) IHC scoring 3+ (positive) with dPCR ratio of 15.39 (positive).
Abbreviations: HER2, human epidermal growth factor receptor 2; IHC, immunohistochemistry; dPCR, digital PCR.
Abbreviations: HER2, human epidermal growth factor receptor 2; IHC, immunohistochemistry; dPCR, digital PCR.