
Figures & data
Table 1 Baseline characteristics and previous cancer treatments
Figure 1 The development in sum of the largest diameters of target lesions in millimeter.
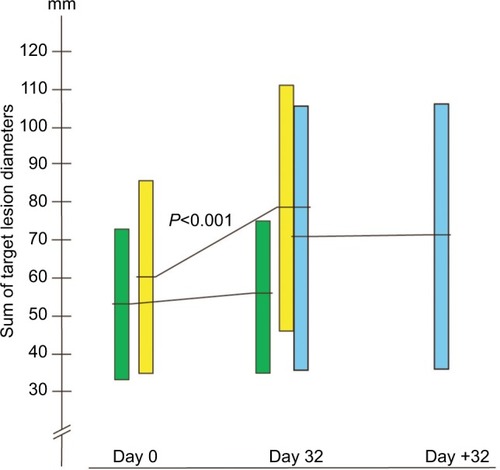
Table 2 Treatment response after 32-day of treatment with BP-C1 and placebo
Figure 2 The development in sum of CTC-NCI toxicity score from screening to Days 16 and 32 in the BP-C1 group and the placebo group.
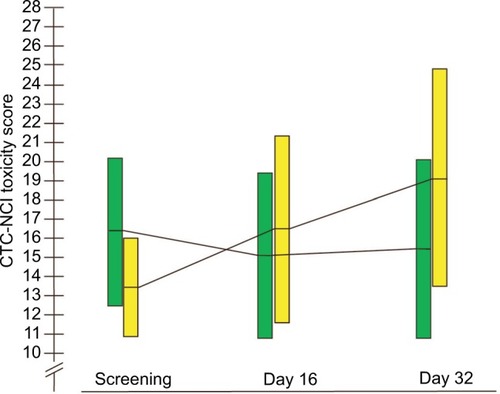
Table 3 Comparison between groups and development within groups with regard to the sum of scores within each of the three parts in questionnaires QLQ-BR23CIs
Table 4 “Negative” and “positive” ER, PR, and HER2 comparison with regard the development in the sum of target diameter lesions
Table 5 Comparison of number of negative receptors with regard the development in the sum of target diameter lesionsCIs