Figures & data
Table 1 Baseline characteristics in the general population and in non-TNBC vs TNBC population
Table 2 Correlation of CK5/6, EGFR, and E-cad with clinical and pathological variables in the TNBC population
Table 3 Correlation of Bcl2, Cox-2, p53, and TOP2A with clinical and pathological variables in the TNBC population
Figure 1 Kaplan–Meier curves in non-TNBC and TNBC subgroups.
Abbreviations: EFS, event-free survival; TNBC, triple-negative breast cancer.
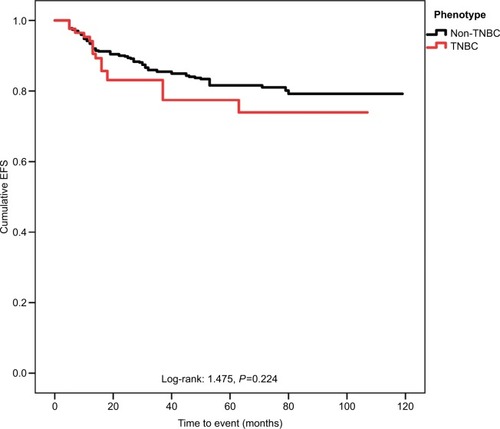
Figure 2 Kaplan–Meier curves in IHC surrogate phenotypes BC population.
Abbreviations: BC, breast cancer; EFS, event-free survival; HER2, human epidermal growth factor receptor 2; IHC, immunohistochemical; TNBC, triple-negative breast cancer.
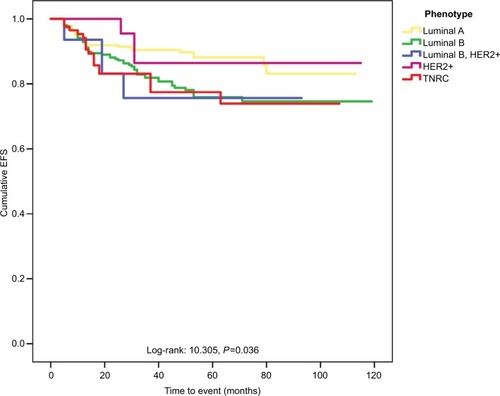
Figure 3 Kaplan–Meier curves according to the CK5/6 expression in TNBC patients.
Abbreviations: CK5/6, cytokeratin 5/6; EFS, event-free survival; TNBC, triple-negative breast cancer.
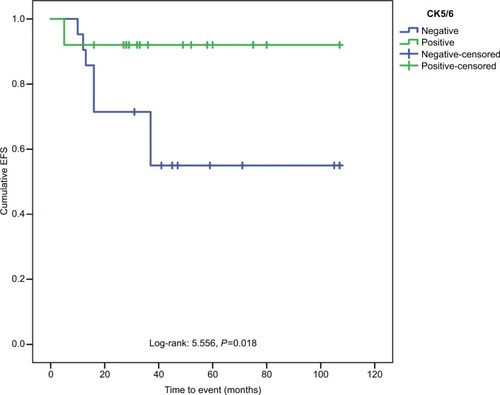
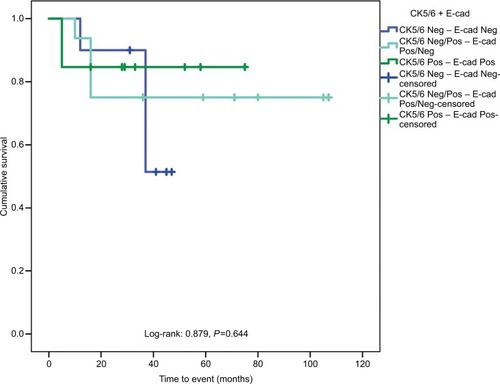
Figure 4 Kaplan–Meier curves in subgroups according to the CK5/6–E-cad score in TNBC patients.
Abbreviations: CK5/6, cytokeratin 5/6; E-cad, E-cadherin; Neg, negative; Pos, positive; TNBC, triple-negative breast cancer.