Figures & data
Table 1 Demographic, clinical, and pathological characteristics of the female breast cancer patients
Figure 1 Chemerin expression in malignant vs normal breast tissues.
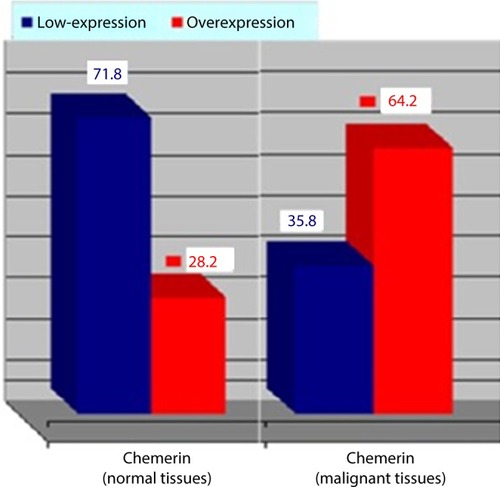
Figure 2 Chemerin expression in the metastatic lymph nodes vs malignant breast tissues.
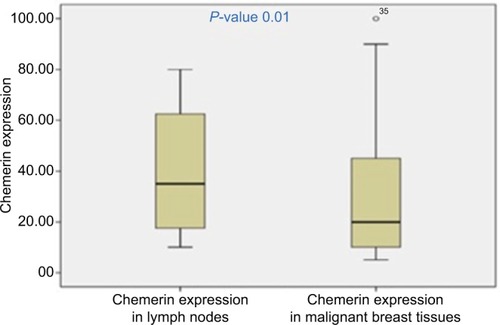
Figure 3 Representative microphotographs of immunohistochemical analysis of chemerin antigen expression in human normal breast tissue and breast cancer tissue.
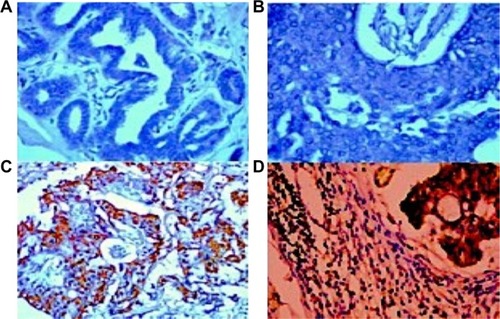
Table 2 The chemerin expression and distribution in malignant vs benign breast tissue
Table 3 Associations of chemerin expression with clinical and pathological characteristics in women with breast cancer
Figure 4 Receiver operating characteristic (ROC) curves of chemerin expression differentiating malignant from adjacent non-tumor breast tissue.
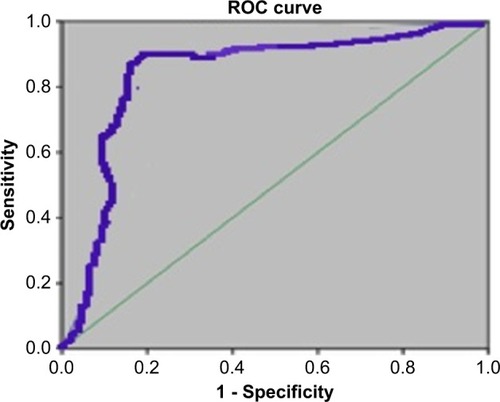
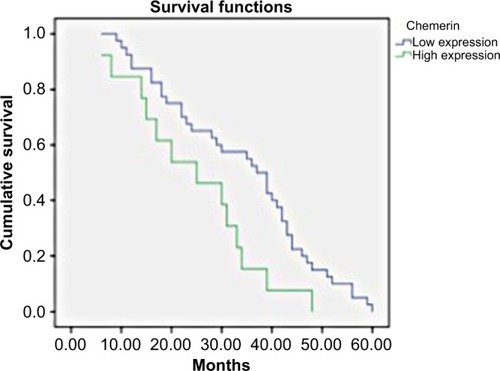
Figure 5 Kaplan–Meier survival curves of female patients with breast cancer according to chemerin expression levels.