Figures & data
Figure 1 TaqMan® Real-time PCR in MCF7 and T47D cells after stimulation with T1AM.
Abbreviation: T1AM, 3-iodothyronamine.
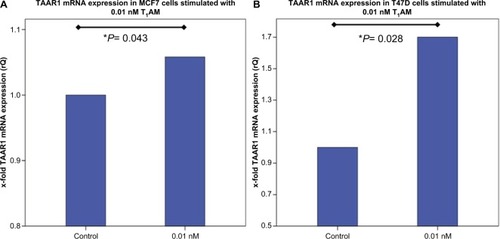
Figure 2 TaqMan® Real-time PCR in MCF7 and T47D cells after stimulation with Tetrac.
Abbreviation: Tetrac, tetraiodothyroacetic acid.
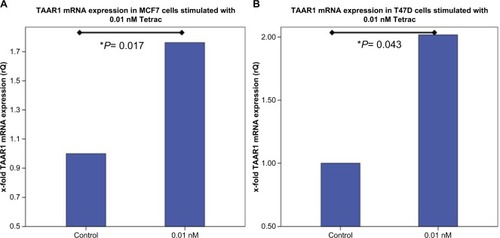
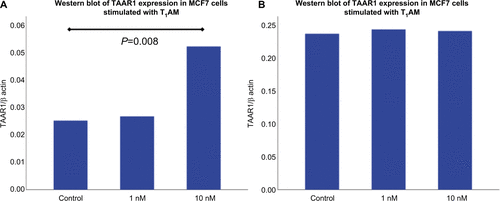
Figure 3 Western blot analysis of TAAR1 protein expression in MCF7 and T47D cells after stimulation with T1AM.
Abbreviation: T1AM, 3-iodothyronamine.
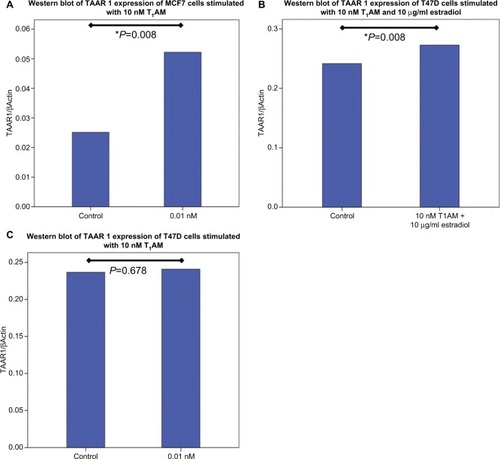
Figure 4 Western blot analysis of TAAR1 protein expression in MCF7 and T47D cells after stimulation with T1AM.
Abbreviation: T1AM, 3-iodothyronamine.
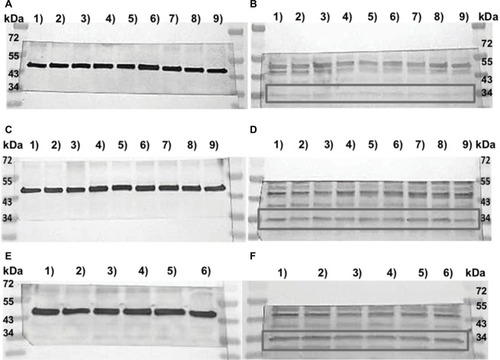
Figure 5 MTT assay of MCF7 cells stimulated with T1AM and T3.
Abbreviations: OD, optical density; T1AM, 3-iodothyronamine.
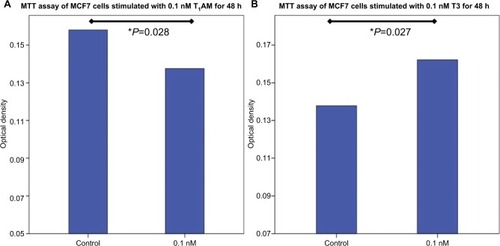
Figure 6 Wound healing assay of MCF7 cells stimulated with T1AM.
Abbreviation: T1AM, 3-iodothyronamine.
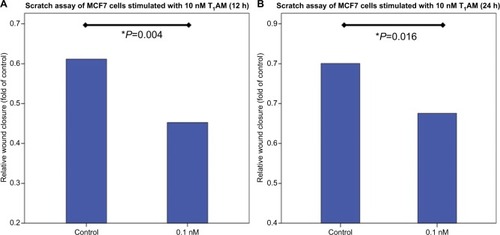
Figure 7 Wound healing assay of MCF7 control and stimulated cells.
Abbreviation: T1AM, 3-iodothyronamine.
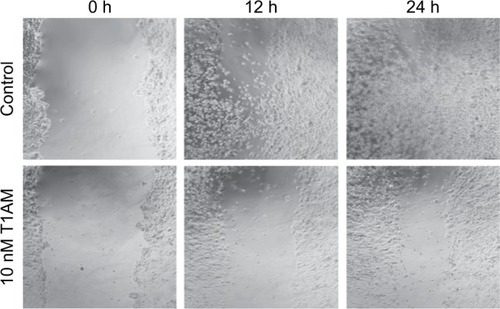
Figure S1 Real-time TaqMan® PCR in MCF7- and T47D- cells after stimulation with T1AM.
Abbreviation: T1AM, 3-iodothyronamine.
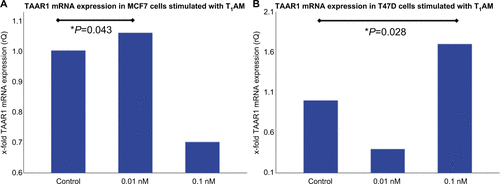
Figure S2 Real-time TaqMan® PCR in MCF7- and T47D- cells after stimulation with Tetrac.
Abbreviation: Tetrac, tetraiodothyroacetic acid.
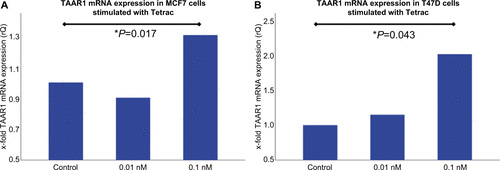
Figure S3 Western Blot analysis of TAAR1 protein expression in MCF7 and T47D cells after stimulation with T1AM.
Abbreviation: T1AM, 3-iodothyronamine.