
Figures & data
Table 1 Patients’ characteristics
Figure 1 Representative 2-DE gel images of protein profiles of invasive breast carcinoma.
Abbreviations: DE, 2-dimensional gel electrophoresis; LA, luminal A; MALDI-MS, matrix assisted laser desorption/ionisation - mass spectrometry; TNBC, triple-negative breast cancer.
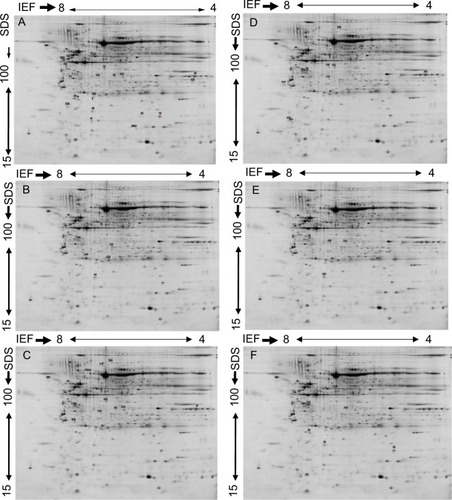
Figure 2 Differentially expressed proteins in breast cancer tissues from AA compared to European women regardless of hormonal status.
Abbreviations: AA, African American; EA, European American;
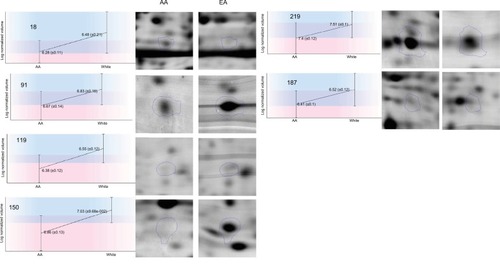
Figure 3 Differentially expressed proteins in (A) Luminal A breast cancer vs TNBC in AA women, (B) LA vs TNBC in European American women, and (C) TNBC in AA women vs TNBC in European American women.
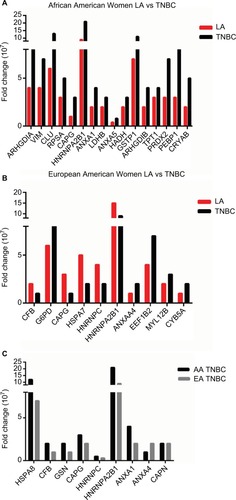
Figure 4 IPA of canonical pathways of differentially altered protein expressed in breast carcinoma (A) LA vs TNBC in African American women; (B) LA vs TNBC in European American women; (C) TNBC in African American women vs TNBC in European American women.
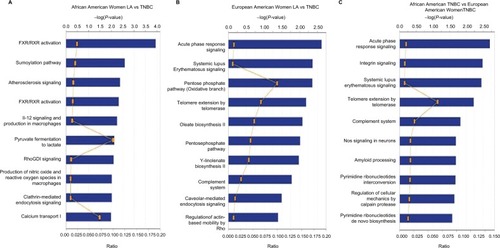
Figure 5 Western blot (A and E) and immunohistochemistry (C) validation of selected shown proteins. Bar graph of the Western blotting assay of all proteins (B) and CYP7B1 (F). Stain intensity of IHC for each protein tested is shown in (D). Each bar represents the relative value of the protein relative to β-actin. For each data point, samples were tested in triplicate; the graph represents the mean ± SD. Asterisks denote significance: *significant at 0.05 and **significant at <0.005.
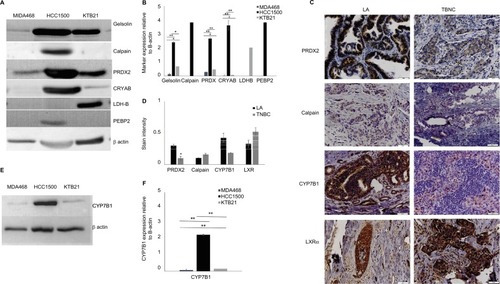
Table 2 Proteins altered in expression between TNBC and LA in African American and European American women