
Figures & data
Table 1 Sequences of primers used in this study
Figure 1 Electrophoresis image of polymerase chain reaction cDNA of hMAM and GAPDH in breast cancer cells.
Abbreviation: hMAM, human mammaglobin mRNA.
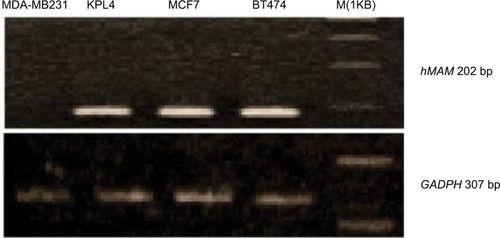
Figure 2 Real-time PCR for cDNA of hMAM to determine the standard curve using BT474 cell lines.
Abbreviation: hMAM, human mammaglobin mRNA; PCR, polymerase chain reaction.
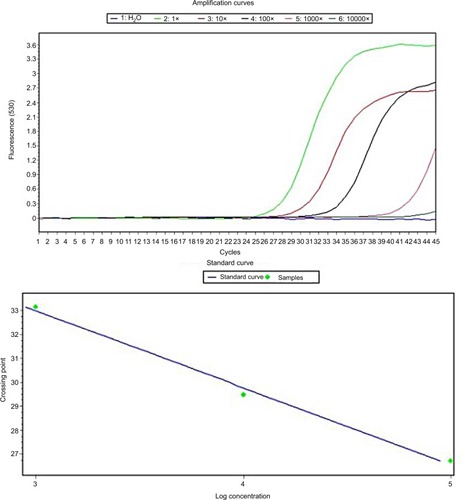
Figure 3 Sequences of hMAM gene in PCR positive.
Abbreviation: hMAM, human mammaglobin mRNA; PCR, polymerase chain reaction.
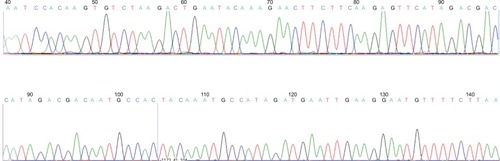
Figure 4 Real-time PCR for hMAM cDNA determined the detection level in BT474 cell lines.
Abbreviation: CP, crossing point; hMAM, human mammaglobin mRNA; PCR, polymerase chain reaction.
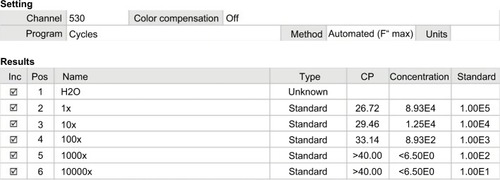
Table 2 hMAM mRNA transcription in the study
Table 3 hMAM expression in the breast cancer tissue and blood according to different characteristics