Figures & data
Figure 1 Model fittings of the concentration–effect relationships for single agents. Symbols represent the means of triplicates of observed data and bars represent the SEMs. Lines are model predictions.
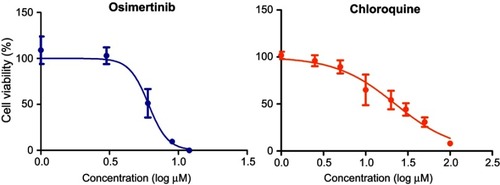
Table 1 Model-estimated parameters for the concentration–effect relationships of single agents. Parameters are reported as mean values and precisions are reported as the percentage of relative standard error (%RSE)
Figure 2 Cell viability response of MDA-MB-231 cells normalized to control after 48 hrs exposure to chloroquine (CQ) and osimertinib (Osim) combinations, and to cell culture medium devoid of drug (control). Each bar represents the mean of four replicates of observed data ± SEM.
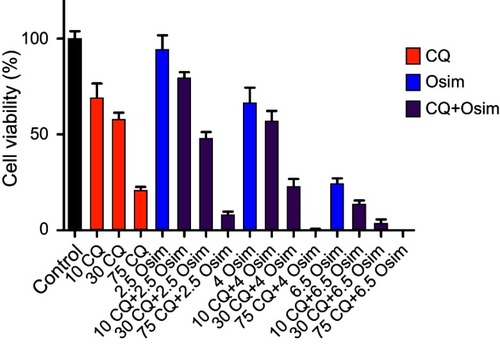
Table 2 Combination indexes (CIs) calculated for the various concentrations of osimertinib/chloroquine association therapy
Figure 3 Fold change from control (no treatment) of LC3B-II in MDA-MB-231 after exposure to chloroquine (CQ), osimertinib (Osim), and combination (O+CQ). MDA-MB-231 cells exposed to control (Con) as drug-free cell culture medium, CQ (30 μM), Osim (6 μM), or the combination over 24 hrs. LC3B-II and GAPDH were measured using Western blot. Each bar represents a mean from duplicate observed data ± SEM. **p<0.01, ***p<0.001.
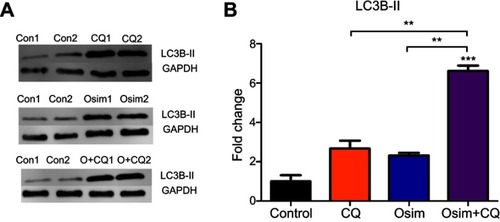
Figure 4 Fold change from control in the expression of signaling proteins in the autophagy–apoptosis crosstalk pathway of MDA-MB-231 cells. Cells were exposed for 48 hrs to chloroquine (CQ, 30 μM), osimertinib (Osim, 6 μM), combination, or control. Each bar represents the mean of four replicates of observed data ± SEM *p<0.05, **p<0.01, ***p<0.001.
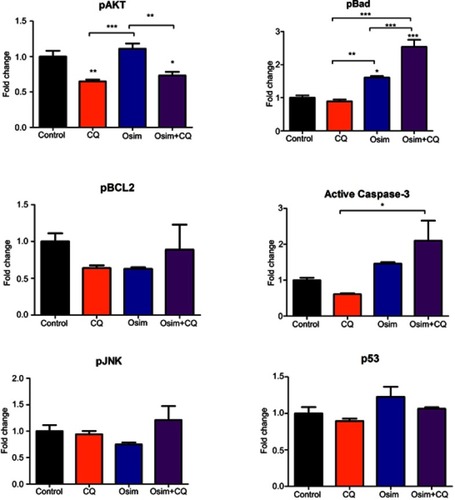
Figure S1 Values used by Compusyn to calculate synergy between Osim and CQ. Fa was calculated for Osim (2.5, 4, and 6.5 µM) and CQ (10, 30, and 75 µM) alone and combination. For each drug combination DRI was calculated where DRI=1, >1, and <1 indicated no dose reduction, a favorable dose reduction, and no favorable dose reduction, respectively. Mean ± SEM was plotted using GraphPad Prism Version 5. Bars represent the mean on quadruplets observed data with SEM.
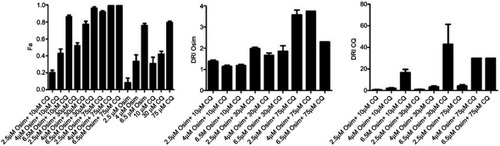
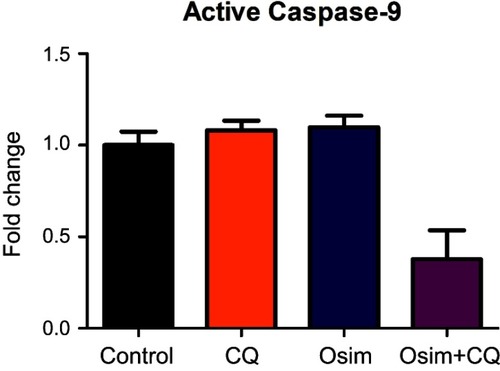
Figure S2 Effects of CQ, Osim, and combination on apoptosis players in MDA-MB-231. MDA-MB-231 cells were exposed to media devoid of drug (control), 30 μM CQ, 6 μM Osim, or combination over 48 hrs. Active caspase-9/GAPDH measured using Western blot, and signal was taken with respect to control. Mean ± SEM was plotted using GraphPad Prism Version 5. Bars represent the mean on quadruplets observed data with SEM.