Figures & data
Figure 1 Growth of subcutaneous MDA-MB-231 tumors in Balb/c nude mice treated with CB-839 or vehicle. Tumor volume was measured daily. Treatment began once they reached approximately 75 mm3. CB-839 treatment (n=4) does not affect result in a reduction in tumor volume relative vehicle-treated controls (n=4).
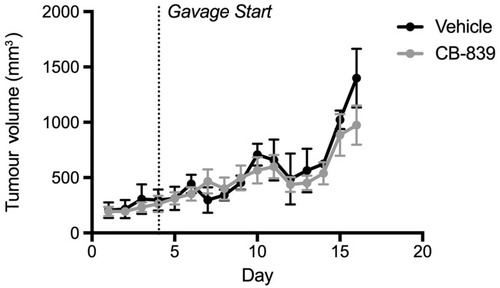
Figure 2 Concentration of glutamate in serum from animals with subcutaneous MDA-MB-231 tumors treated with CB-839 (n=4) or vehicle (n=4). (A) Concentration of glutamate in serum relative to vehicle-treated animals (P=0.0781 by unpaired t-test). (B) The ratio of glutamine to glutamate in serum indicating that glutamine levels significantly increase in the serum of mice-treated with CB-839 (P<0.001 by unpaired t-test).
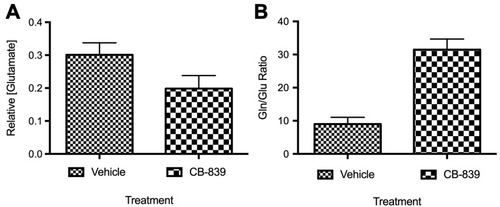
Figure 3 Assessment of pain behaviors – dynamic weight bearing (A) dynamic plantar aesthesiometer (B) behavioral testing was done twice per week to monitor development of CIBP behaviors until endpoint. No significant changes between CB-839 (n=8) and vehicle-treated (n=11) groups were observed in both tests.
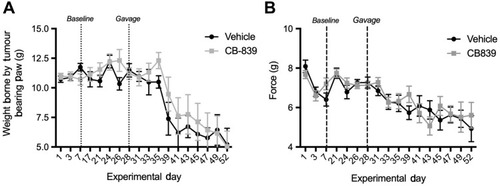
Figure 4 Radiographic lesion scoring of MDA-MB-231 tumors at endpoint. Representative images of vehicle and CB-839-treated groups are presented and osteolysis from tumor development is indicated by white arrows. A graphical representation of radiographic lesion scoring of all animals in each group is shown.
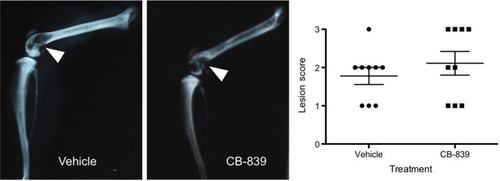
Figure 5 Effect of sodium pyruvate on CB-839 induced changes in glutamate release and cell survival in vitro CB-839 reduces extracellular glutamate (A) relative to the vehicle (DMSO) control at concentrations above 12 uM only in the absence of sodium pyruvate in culture media (P<0.005). No significant changes observed in the presence of sodium pyruvate. CB-839-induced decrease in cell number after treatment for 72 hrs observed only in the absence of sodium pyruvate in culture media (B). Non-linear regression of (B) results in a shift in EC50 values between “no sodium pyruvate” (EC50=4.997 nM) and “with sodium pyruvate“ (EC50=11.07) indicating that cellular proliferation and/or survival is affected by CB-839 treatment only when sodium pyruvate is absent from culture media.
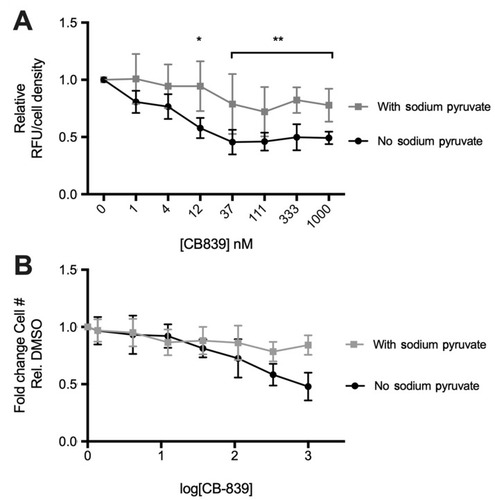
Figure 6 Production of reactive oxygen species over the course of 24 and 72 hrs (A) and cystine uptake after 72 hrs treatment with 1 μM CB-839 (B). A significant increase in ROS (A) is observed after a 72 hrs incubation with 1000 nM CB-839 (P<0.05; 2-way repeated measures ANOVA). Similarly, [14C]-cystine uptake (B) increases significantly by 72 hrs but only in the absence of sodium pyruvate (P<0.01; 2-way repeated measures ANOVA).
![Figure 6 Production of reactive oxygen species over the course of 24 and 72 hrs (A) and cystine uptake after 72 hrs treatment with 1 μM CB-839 (B). A significant increase in ROS (A) is observed after a 72 hrs incubation with 1000 nM CB-839 (P<0.05; 2-way repeated measures ANOVA). Similarly, [14C]-cystine uptake (B) increases significantly by 72 hrs but only in the absence of sodium pyruvate (P<0.01; 2-way repeated measures ANOVA).](/cms/asset/41ba743e-ec42-4160-abf5-9c2045bece85/dbct_a_31571981_f0006_b.jpg)
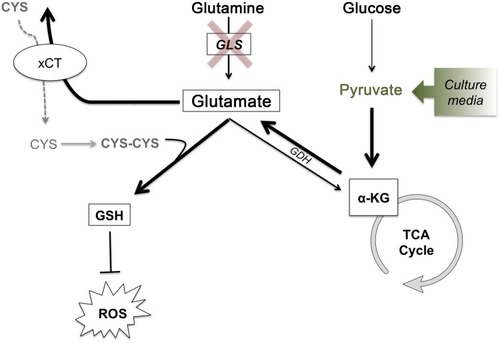
Figure 7 Glutathione synthesis for ROS detoxification drives metabolic adaptations to maintain glutamate production and cystine acquisition in the absence of GLS activity. Glutathione synthesis for ROS detoxification drives metabolic adaptations to maintain glutamate production and cystine acquisition in the absence of GLS activity. In the absence of GLS activity, glucose-derived pyruvate can feed the TCA cycle generating α-KG, which can then be used to generate glutamate via glutamate dehydrogenase. With the intracellular pool of glutamate maintained, GSH production can continue, both with glutamate itself as a component for GSH and as an exchange factor for cystine, the rate-limiting substrate of GSH synthesis. Bolded arrows represent the pathway that is hypothesized to compensate for loss of glutamine-derived glutamate under conditions of GLS inhibition or low glutamine conditions. Under in vitro conditions, the addition of sodium pyruvate to cell culture media drives this process.