Figures & data
Figure 1 Experimental plan and concept of lymph collection. (A) Scheme illustrating the tumor cells spread throught the lymphatic and haemotgeous system in women. (B) Outline of the experimental design and tumor implantation. (C) Visuslaiztion of afferent lymphatic vessles (green color).
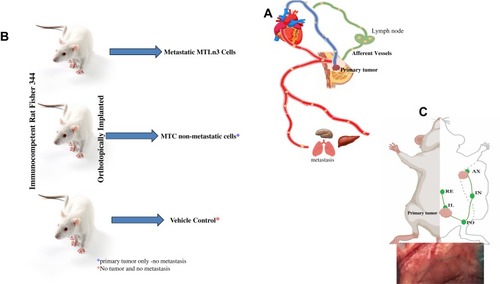
Figure 2 (A) Summary of protein numbers obtained from the lymph from healthy animals, metastatic tumor-bearing and non-metastatic tumor-bearing animals. (B) differntailly expressed protein between lymph and plasma from metastatic tumor-bearing animals. (C) Differntailly expressed protein between lymph from metastatic and non-metastatic tumor-bearing animals.
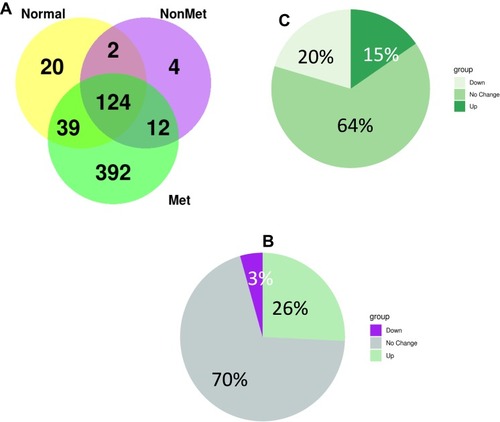
Table 1 Proteins Differentially (>175 Fold) Expressed in Lymph from Metastatic Tumor-Bearing Compared to Lymph from Non-Metastatic Tumor-Bearing Animals
Figure 3 (A) Top 10 pathways enriched in differentially expressed proteins in lymph from metastatic tumor-bearing animals versus lymph from non-metastatic tumor-bearing ainmals. (B) Top 10 pathways enriched in differentially expressed proteins in lymph compared to plasma from metastatic tumor-bearing animals. Activation state of the pathway was calculated using an activation z-score. Up-regulated pathways are shown in red, down-regulated are shown in blue, and those in which the activation state could not be determined are shown in grey. Number of proteins in each group is shown for each pathway in the pie chart. All pathways shown have an adjusted p-value < 0.05.
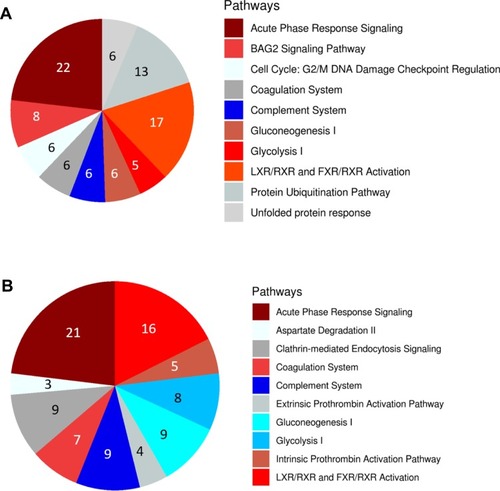
Figure 4 Protein expressions in tumor-draining lymph from animals with metastatic tumor and the involvement of signaling pathways. (A) A spring layout algorithm was used to show the most significant GO terms associated with proteins that had a more extreme relative difference that + or −50. Molecular function GO terms are light blue, biological process GO terms are teal, and proteins are colored in red. A Bonferroni corrected p-value of 0.01 was used as the cutoff, and the top 25 GO terms were selected. (B) Summary of biological pathways indicating the down-regulated and up-regulated genes and the P value of enrichment. (C) Significantly activated 10 top immune-related pathways that in the metastatic lymph compared to non-metastatic lymph.
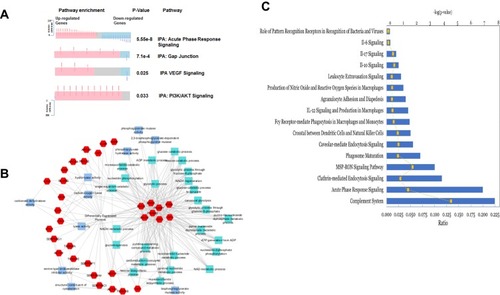
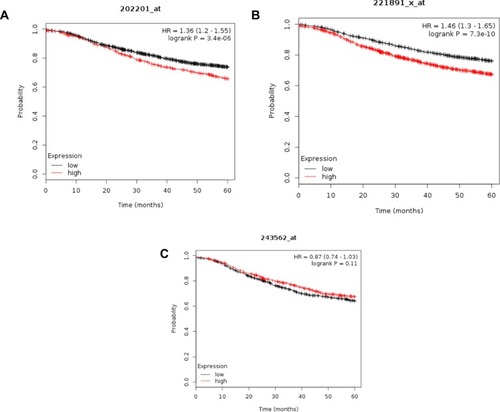
Figure 5 Kaplan-Meier survival analysis of human patients (n=3951) with invasive breast cancer divided into two groups based on the expression level of HSPA8 (A), BLVRB (B), and KING1 (C). Log rank test P-value is displayed. HR, hazard ratio.