Figures & data
Figure 1 Flowchart of medical record abstraction procedure.
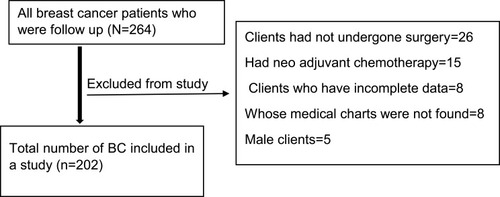
Table 1 Characteristics of Women with Breast Cancer at the University of Gondar Compressive Specialized Hospital
Figure 2 Kaplan–Meier survival curves for women with BC among co-morbidity categories.
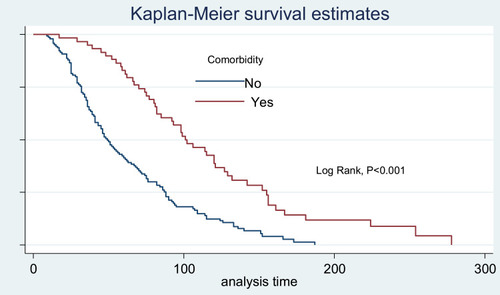
Figure 3 Kaplan–Meier survival curves compare TAC in women with BC among surgical complication categories.
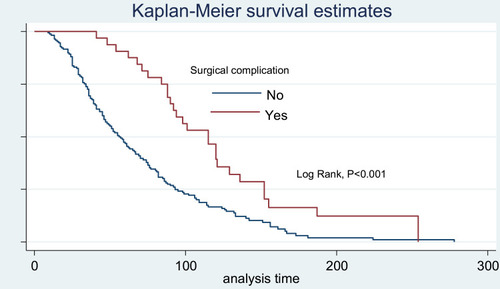
Table 2 Survival Time and Log Rank Test for Different Categorical Variables of Breast Cancer Patients at University of Gondar Compressive Specialized Hospital from Jan 2015 to Feb 2019
Table 3 Test of Proportional Hazard Assumption Based on Schoenfeld Residuals for the Covariates Among Breast Cancer Patients at University of Gondar Compressive Specialized Hospital from Jan 2015 to Feb 2019
Figure 4 Proportional hazard plot by co-morbidity categories among women with BC.
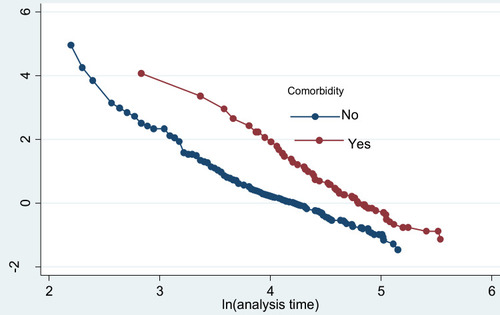
Figure 5 Proportional hazard plot by number of excision among BC patients.
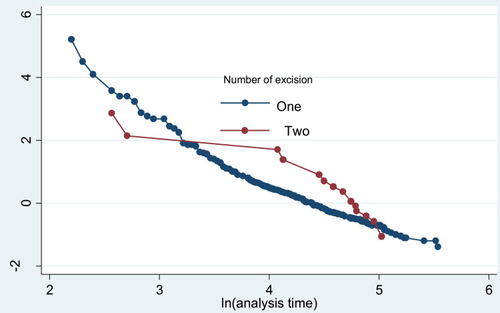
Table 4 Bi-Variable and Multivariable Stratified Cox Regression Analysis of Women with Breast Cancer Patients at University of Gondar Compressive Specialized Hospital from Jan 2015 to Feb 2019
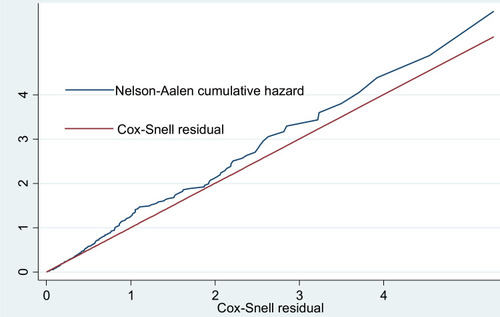
Figure 6 Goodness of fit for the stratified Cox model of BC patients.