Figures & data
Table 1 Clinicopathologic Characteristics of the Studied Tumors
Table 2 Primer Sequence for YAP1, NANOG, OCT4and SOX-2
Table 3 Nuclear Expression of YAP1 in Relation to Ki67%, ER, PR, Her2 and Tumor Molecular Subtype
Figure 1 Immunohistochemical expression of YAP1 in breast cancer. (A) Normal breast acini showing expression of YAP1 in myoepithelial cells and cytoplasmic expression in luminal cells (Immunoperoxidase, x400). (B) Ductal carcinoma in-situ (DCIS) showing cytoplasmic expression of YAP1 in ductal epithelial cells (Immunoperoxidase, x200). (C and D) Invasive ductal carcinoma, NST (luminal type) showing cytoplasmic and nuclear expression of YAP1 in tumor cells (Immunoperoxidase, x200).
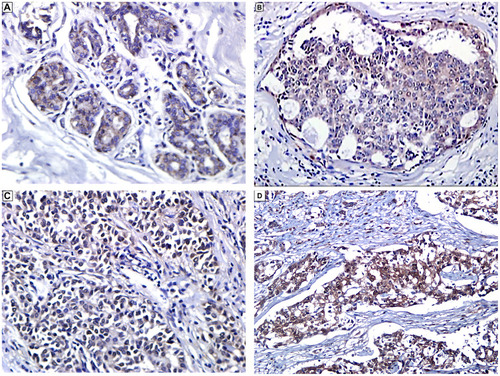
Figure 2 YAP1 mRNA expression in the different molecular subtypes of breast cancer. qRT-PCR analysis showing significant increase in average YAP1 mRNA in luminal compared to TNBC (*P = 0.017).
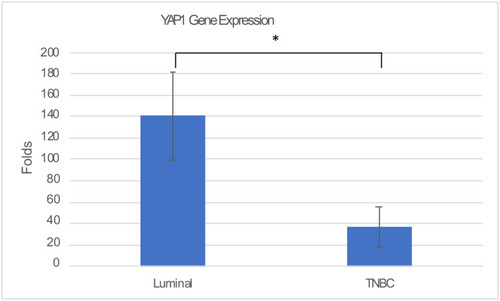
Table 4 Stem Cell Marker Expression in Breast Cancer in Relation to the Different Clinicopathological Characteristics of the Tumors
Figure 3 (A) NANOG, OCT4 and SOX2 mRNA expression in breast cancer and control. (A) Transcript levels of NANOG, OCT4and SOX2 in breast cancer tissues and normal breast tissues quantified by qRT-PCR and presented as fold induction showing significant increase in NANOG and OCT4 in Breast cancer. *P < 0.05, **P < 0.01. (B) MCF-7 cells showing significant reduction in mRNA expression of YAP1, SOX2 and NANOG in response to VP treatment. *P < 0.05. (C) MDA-MB-231 cells showing reduction in expression of YAP1 and SOX2 and increase in NANOG in response to VP treatment. *P < 0.05.
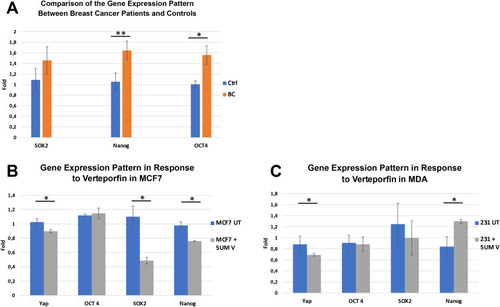
Figure 4 YAP1 expression in MCF-7 and MDA-MB-231 breast cancer cell line. (A) qRT-PCR analysis showing no significant difference in YAP1 expression between MCF-7 and MDA-MB-231 breast cancer cell lines. (B, C) Immunohistochemical expression of YAP1 in cytoplasm and nucleus in both MCF-7 (B) and MDA-MB-231 (C) cells (Immunoperoxidase, x200).
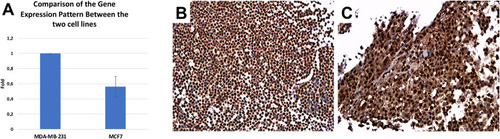
Figure 5 The effect of verteporfin single treatment. (A) MTT assay showing the effect of single treatment of MCF-7 cell lines with verteporfin for 24 hours at doses of 0.1, 0.5, 1, 5 and 10 uM (*= p-value <0.0001). (B) MTT assay showing the effect of single treatment of MDA-MB231 cell lines with verteporfin for 24 hours at doses of 0.1, 0.5, 1, 5 and 10 uM (*= p-value <0.0001). (C) Western Blotting showing the effect of VP treatment on YAP1 protein expression in both MCF-7 and MDA-MB-231 cell lines (YAP1 1;1000 mouse monoclonal antibody (Cat. # MAB8094, R&D system), B-actin 1;1000 Rabbit antibody (cell signaling), secondary antibodies: Anti-rabbit (1/1000) for B-actin, Anti-mouse for YAP1). A specific band was detected for YAP1 at approximately 70–75 kDa, band for B-actin was detected at approximately 42–45 kDa.
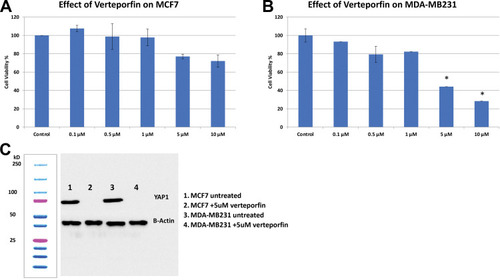
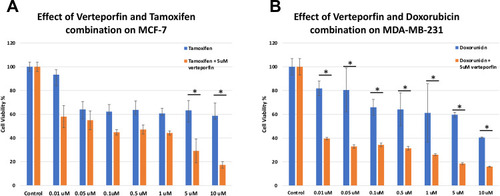
Figure 6 Cell viability with and without pre-treatment with verteporfin. (A) Effect of combined treatment with verteporfin and tamoxifen on the viability MCF-7 cells tested by MTT. The cells were treated with Tamoxifen (Tam) alone, at concentrations of 0.01, 0.05, 0.1, 0.5, 1, 5 and 10 uM, and with the same doses of Tamoxifen after 24-hour pre-treatment with verteporfin (VP) at a dose of 5 uM. Statistical difference was tested using ANOVA test and posthoc Tukey Kramer. (*= p-value <0.0001). (B) Effect of combined treatment with verteporfin and doxorubicin on the viability of MDA-MB-231 cells tested by MTT. The cells were treated with Doxorubicin (Dox) alone, at concentrations of 0.01, 0.05, 0.1, 0.5, 1, 5 and 10 uM, and with the same doses of doxorubicin after 24-hour pre-treatment with verteporfin (VP) at a dose of 5 uM. Statistical difference was tested using ANOVA test and posthoc Tukey Kramer. (*= p-value <0.0001).