186
Views
4
CrossRef citations to date
0
Altmetric
Original Research

Mirna21 Expression in the Breast Cancer Tumor Tissue is Independent of Neoadjuvant Chemotherapy

ORCID Icon, ORCID Icon, , ORCID Icon, ORCID Icon, ORCID Icon, ORCID Icon, ORCID Icon & ORCID Icon show all
Pages 141-151 | Published online: 08 Oct 2020

Figures & data

Table 1 Clinical and Pathological Characteristics of Patients with Breast Cancer

Figure 1 Patterns of miRNA-21 Expression in Breast Cancer Tissue. (A) miRNA-21 expression in tumor tissue and in breast tissue from controls. miRNA-21/RNU6B was calculated using the 2−ΔΔCt method. The expression values are presented as the ΔΔCq value on a log2 scale. (B) Absolute quantification of miRNA-21 expression, presented as the means of the Cq values. Statistical analysis was performed using a generalized linear model. Data are presented as the mean ± SE. Black dots represent outliers.

Figure 1 Patterns of miRNA-21 Expression in Breast Cancer Tissue. (A) miRNA-21 expression in tumor tissue and in breast tissue from controls. miRNA-21/RNU6B was calculated using the 2−ΔΔCt method. The expression values are presented as the ΔΔCq value on a log2 scale. (B) Absolute quantification of miRNA-21 expression, presented as the means of the Cq values. Statistical analysis was performed using a generalized linear model. Data are presented as the mean ± SE. Black dots represent outliers.

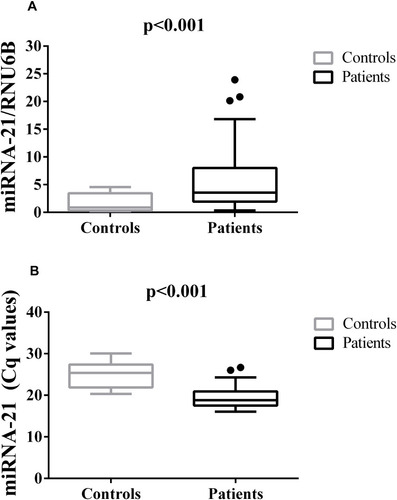
Table 2 miRNA-21 Expression According to Breast Cancer Prognostic Factors

Figure 2 Correlation of miRNA-21 Expression with Tumor Size and Response to Neoadjuvant Chemotherapy. (A) Correlation between miRNA-21 and tumor size (cm) (Spearman’s rank correlation coefficient). (B) miRNA-21 expression considering exposure to NAC (or not) and achievement of PCR (miRNA-21/RNU6B was calculated using the 2−ΔΔCt method). The expression values are presented as the ΔΔCq value on a log2 scale (generalized linear model) (C) miRNA-21 expression based on the means of the Cq values and considering exposure to NAC and achievement of PCR (generalized linear model). Data are presented as the mean ± SE.

Abbreviations: PCR, pathological complete response; NAC, neoadjuvant chemotherapy; Naïve, chemotherapy naïve.
Figure 2 Correlation of miRNA-21 Expression with Tumor Size and Response to Neoadjuvant Chemotherapy. (A) Correlation between miRNA-21 and tumor size (cm) (Spearman’s rank correlation coefficient). (B) miRNA-21 expression considering exposure to NAC (or not) and achievement of PCR (miRNA-21/RNU6B was calculated using the 2−ΔΔCt method). The expression values are presented as the ΔΔCq value on a log2 scale (generalized linear model) (C) miRNA-21 expression based on the means of the Cq values and considering exposure to NAC and achievement of PCR (generalized linear model). Data are presented as the mean ± SE.

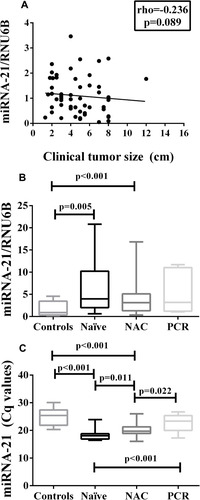
Table 3 Prognostic Factors and miRNA-21 Expression in Patients Treated with Neoadjuvant Chemotherapy