
Figures & data
Figure 1 Simplification of the Frick’s model following the use of a low-frequency current.
Abbreviations: Re, extracellular resistance; Ri, intracellular resistance; C, cell membrane capacitance.
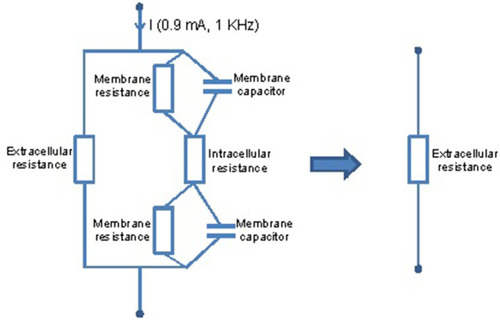
Figure 2 Program flowchart.
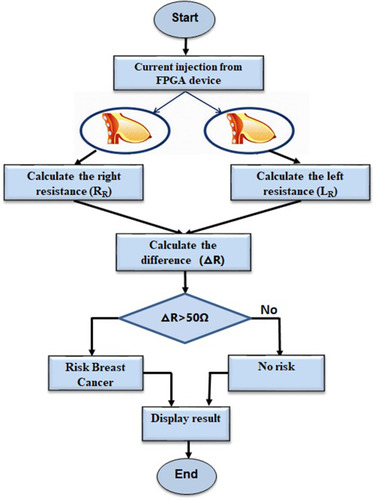
Table 1 Intracellular and Extracellular Concentrations of Ions
Figure 3 Different solutions of Na+Cl− with water volume = 340 mL.
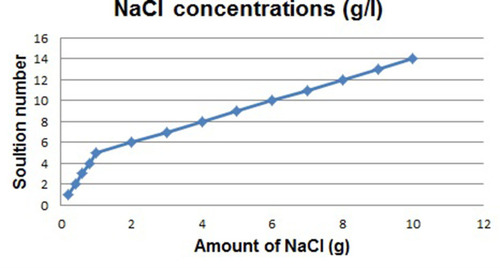
Figure 4 Bland-Altman analysis for resistors measurement accuracy, with Bias = 5.09, upper LOA= 20.36 and lower LOA= −10.18.
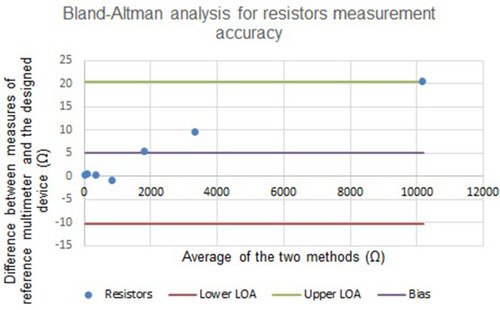
Figure 5 Resistance variation as a function of Na+Cl− concentration.
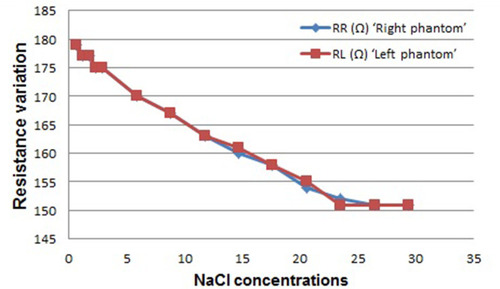
Figure 6 Evolution of the resistance as a function of time for different Na+Cl− concentrations.
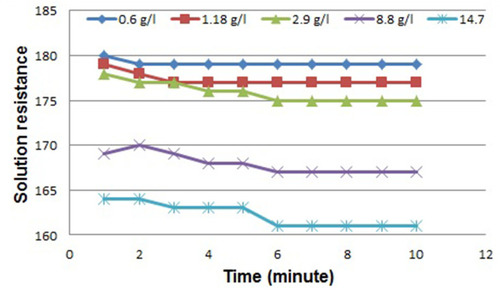
Table 2 In Vivo Measurements