Figures & data
Figure 1 Volcano map of differentially expressed genes (DEGs). The red and green dots indicate DEGs that were significantly upregulated (474 genes) and downregulated (990 genes), respectively (adjusted p-value < 0.05, and |logFC| > 1).
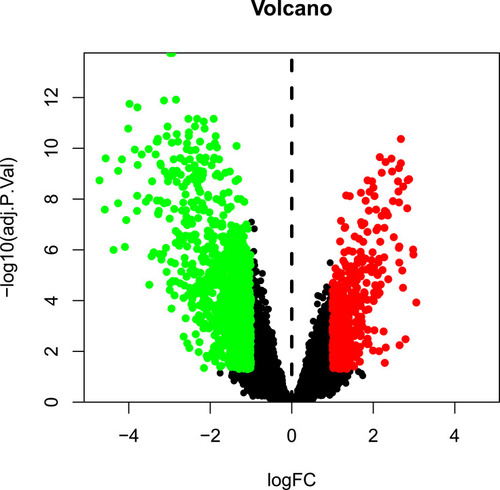
Figure 2 Heatmap of differentially expressed genes. Red indicates that the gene is highly expressed in the sample, and green indicates that the gene has lower expression in the sample.
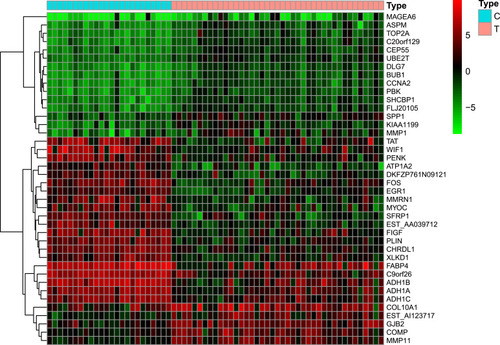
Figure 3 Ingredients–target genes network of Xihuang pill. Ellipse, chemical compounds from different herbs; Green rectangle, target genes.
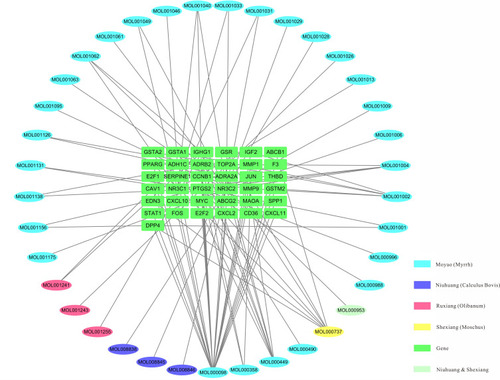
Table 1 Top 10 Genes in the Network Ranked by Degree
Table 2 Top 10 Genes in the Network Ranked by Betweenness
Table 3 Top 10 Genes in the Network Ranked by Closeness
Figure 4 Protein–protein interaction (PPI) network of target genes. The network featured 36 nodes and 151 edges with a combined score >0.4 and PPI enrichment p-value < 1.0e−16.
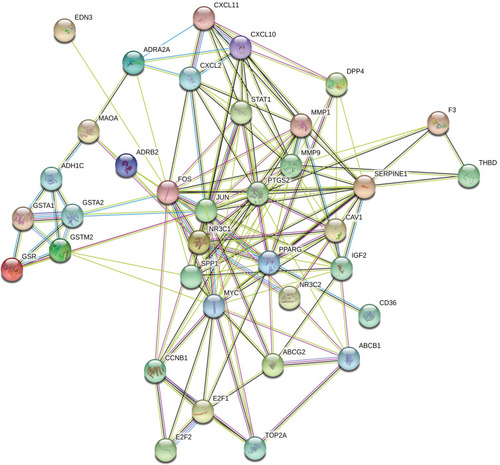
Figure 5 Protein–protein interaction network of core proteins. Seven genes were found in the intersections of the top 10 genes according to degree, betweenness, and closeness.
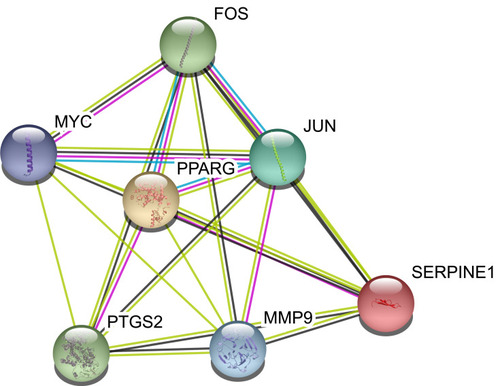
Figure 6 Biological process analysis of the target genes. The top 20 biological processes enriched in Gene Ontology analysis are presented. The bubble size indicates the gene count, and the color indicates the adjusted p-value.
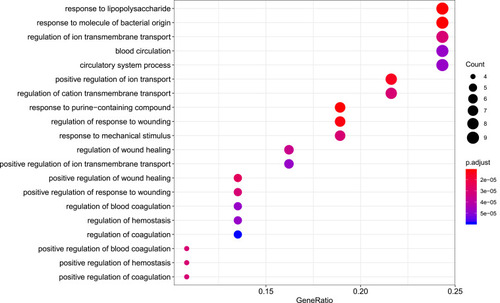
Figure 7 Cellular component analysis of the target genes. The top 20 cellular components enriched in Gene Ontology analysis are presented. The bubble size indicates the gene count, and the color indicates the adjusted p-value.
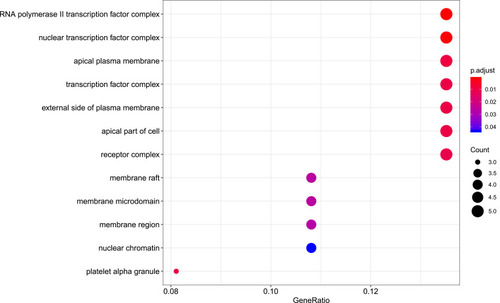
Figure 8 Molecular function analysis of the target genes. The top 20 molecular functions enriched in Gene Ontology analysis are presented. The bubble size indicates the gene count, and the color indicates the adjusted p-value.
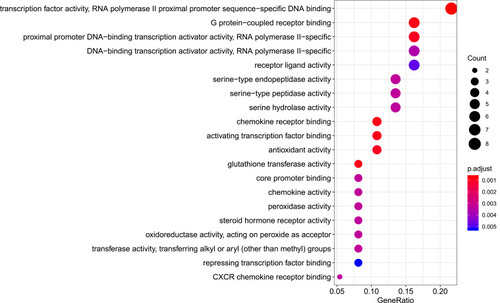
Figure 9 Kyoto Encyclopedia of Genes and Genomes (KEGG) pathway analysis of the target genes. The top 20 enriched KEGG pathways are presented.
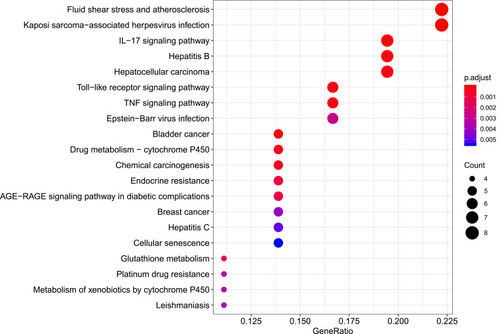
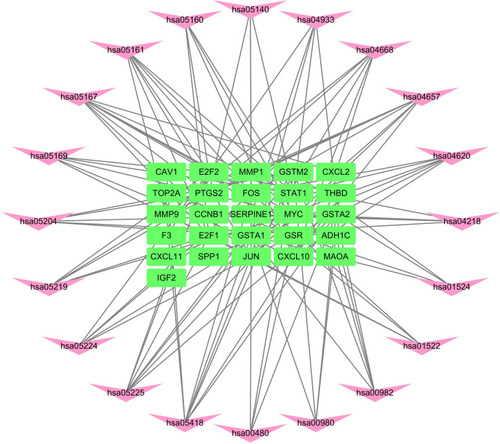
Figure 10 Network of the target genes–Kyoto Encyclopedia of Genes and Genomes (KEGG) pathways. The pink darts indicate KEGG pathways, and the green rectangles indicate target genes.