Figures & data
Figure 1 Immunohistochemistry of (A) CK5/6 (red arrow: positively stained in cytoplasmic membrane and cytoplasm of tumor cell). (B) EGFR (red arrow: positively stained in cytoplasmic membrane and cytoplasm of tumor cell). (C) p53 mutant (red arrow: positively stained in nucleus of tumor cell). Bar: 10 µm. Magnification: 400 times.
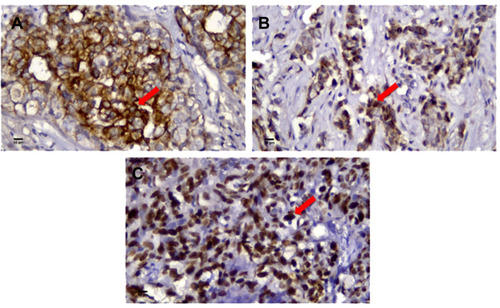
Table 1 AUC Value of miR-223 ROC
Table 2 Clinicopathologic Profile of TNBC Patients with miR-223 Underexpression and Overexpression
Figure 2 ROC Curve of miR-223 to Predict 36-months OS with AUC of 0.706.
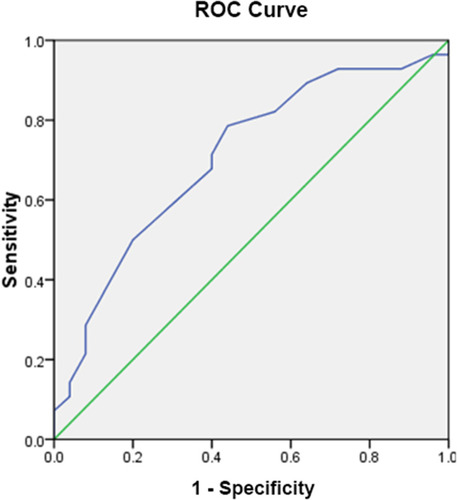
Table 3 Mean OS of TNBC Patients According to miR-223 Expression
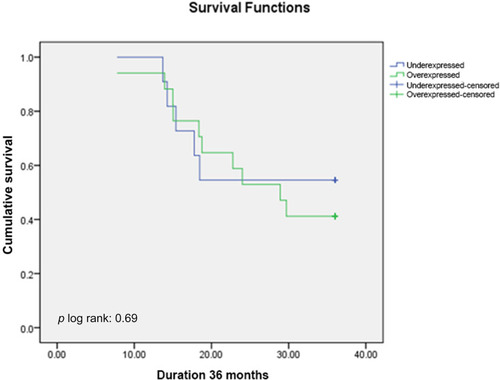
Figure 3 Kaplan–Meier Overall Survival Curve of All TNBC Patients According to miR-223 Expression.
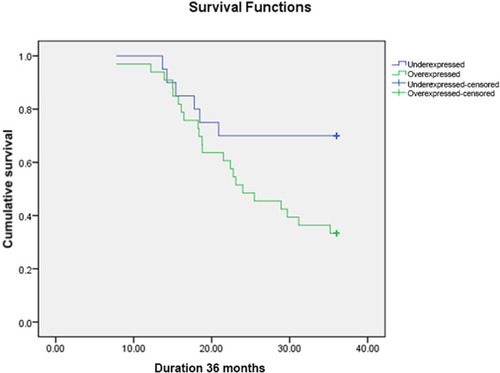
Figure 4 Kaplan–Meier Overall Survival Curve of TNBC Patients Treated with Platinum-containing Regimen According to miR-223 Expression.
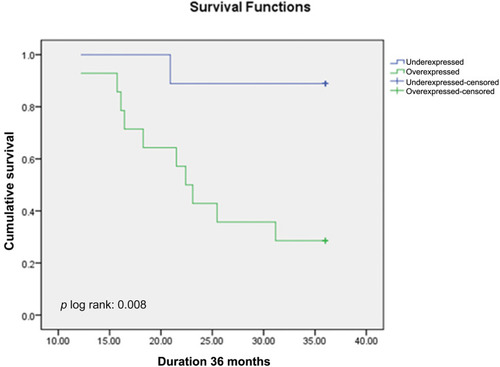
Figure 5 Kaplan–Meier Overall Survival Curve of TNBC Patients Treated with Non-platinum-containing Regimen According to miR-223 Expression.