Figures & data
Table 1 Breast Magnetic Resonance (BMR) and Histology Correlation of Silicone-Induced Granuloma of Breast Implant Capsule (SIGBIC)
Figure 1 (A–D). BMRI of the breasts: T1-weighted sequence (A), T2 sequence with fat saturation (B), silicone-sensitive sequence (C), and dynamic phase image (D). The silicone implant (white triangle) is rotated (yellow asterisk). A solid-cystic tumor (red circle) can be observed near the base of the implant (seal), where a discontinued area of the fibrous capsule is present. The discontinued area connects the intracapsular space with the tumor (orange arrow). There is no intracapsular collection.
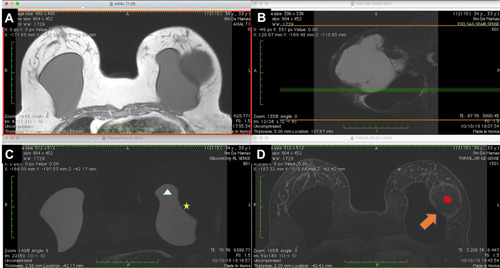
Figure 2 (A–C) B-mode ultrasonography of the tumor (A), with Doppler spectral study (B) and Doppler-flowmeter (C). The silicone implant shows echotextural modification characterized by echogenic lines. An area of discontinuity is visible in the fibrous capsule with interceding septa (orange arrow). The tumor area shows debris indicating high cellularity of the collection (A). The Doppler spectral scan in the mass area of the tumor (red circle) shows a vascular bundle with the arterial flow pattern. The Doppler bean determines the debris motion (blue color in the box) (B). The tumor is well defined by ultrasound scan, with a predominance of vascularization in the parietal mass and no signs of invasion of the adjacent tissue (C).
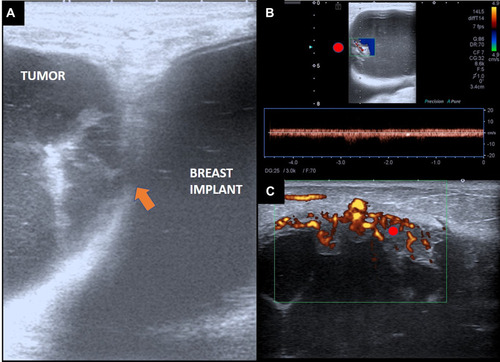
Figure 3 PET-CT of the tumor (red circle) shows 18FDG uptake, especially in the mass area inside the tumor. The uptake in the tumor capsule is less intense, but well defined in the acquired images. The silicone implant (white triangle) is rotated, with a low uptake area in the fibrous capsule dehiscence (orange arrow).
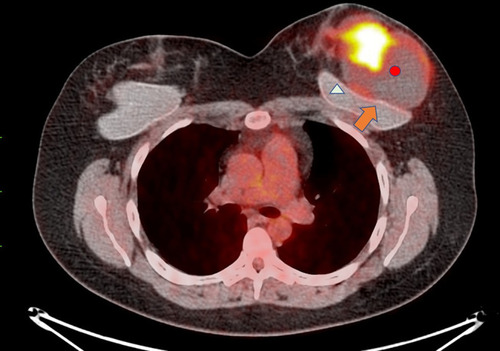
Figure 4 Macroscopic assessment of tumorectomy. Macroscopic assessment of the tumor shows wine vegetation with thick serous-bloody content. The material was friable on palpation and margins were compromised.
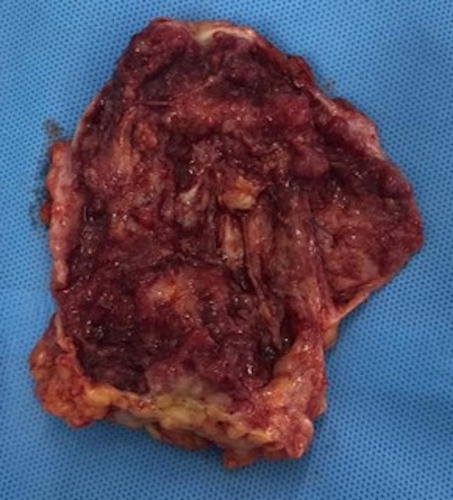
Figure 5 (A–C) Tumor histology with the diagnosis of medullary carcinoma. Microscopy at lower magnification demonstrates undifferentiated cells with syncytial growth, intense inflammatory infiltrate with a predominance of T lymphocytes (black asterisk), and invasion of the capsule (white arrow) (A). The immune profile (pancytokeratins) shows staining the epithelial cells with the tumor markers AE1 and AE3 (B). In a greater augmentation, foamy histiocytes are observed between the inflammatory process (green arrow) (C).
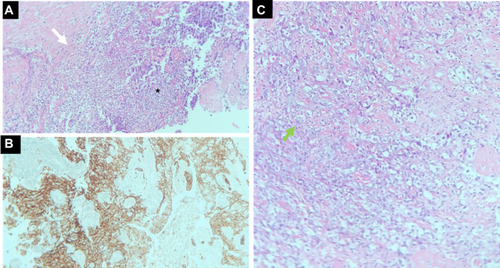
Figure 6 (A–C) Early postoperative BMRI T1-weighted sequence (A), T2 sequence with fat saturation (B), silicone-sensitive sequence (C), and image obtained after contrast administration (D). The silicone implant (white triangle) is rotated to the opposite side to the first exam (yellow asterisk). No residual mass or intracapsular/extracapsular collections are observed.
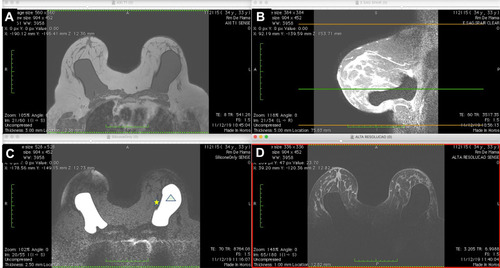
Figure 7 (A–D) BMRI after breast adjuvant chemotherapy showing a T1-weighted sequence (A); T2 sequence with fat saturation (B); silicone-sensitive sequence (C); and image obtained after contrast enhancement (D). The silicone implant (light green triangle) is rotated (yellow asterisk) compared to . However, this figure shows an intracapsular mass formation and late-contrast enhancement in the projection of the implant fractured area (arrow blue) compatible with SIGBIC. A small/intermediary intracapsular collection is observed (gray square).
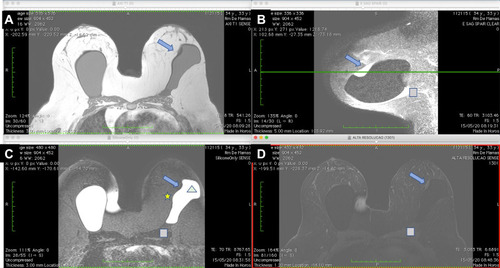
Figure 8 Macroscopic assessment of the mastectomy. Macroscopic assessment of the implant shows the implant surface without visible signs of rupture, with thick fluid in between and fibrous beams. Areas of focal thickening and greater vascularization are visible.
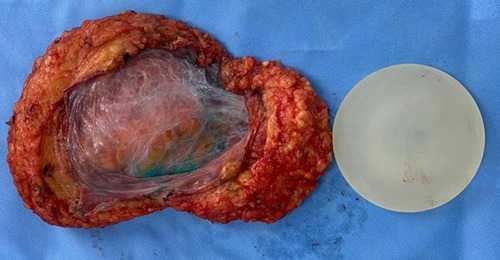
Figure 9 (A–D) Histological assessment of the fibrous capsule after mastectomy. There is no residual tumor on examination. Accumulation of histiocytes between the fibrous capsule (black arrow) (A). Another area with an accumulation of macrophages in the fibrous capsule (green, blue and yellow arrow) with a giant cell reaction (B and D). Giant cells and foamy histiocytes (red arrow) (C).
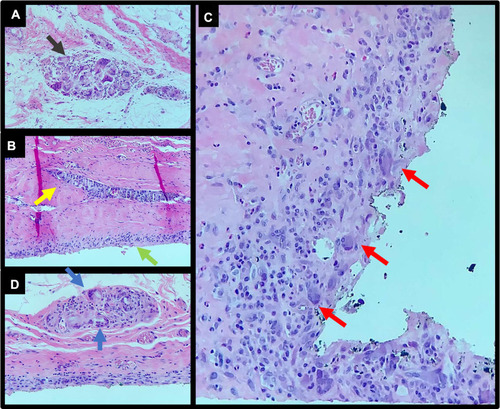
Figure 10 (A–D) Evaluation of the breast implant. Microscopy of the implant’s interior with a 1600× magnification showing signs of chemical reaction of the internal content, with droplets inside the implant (yellow asterisk) (A). Macroscopic assessment shows that the implant is intact (B). The transition surface between the textured and smooth surfaces on the implant seal shows fissured detachment of the surfaces with exposure of the internal content (blue arrow). The interior of the implant also shows changes in color, with a cloudier appearance containing foreign bodies (x green) (C). At the surface transition, deterioration of the implant surface is visible with hematic material in between (brown triangle) (D).
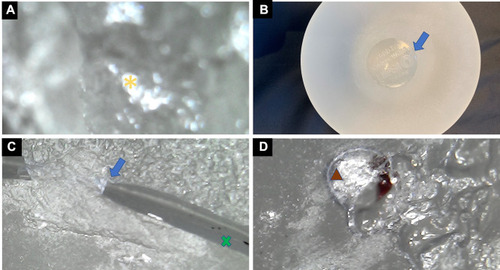
Figure 11 Schematic illustration of acinar-ductal metaplasia (ADM).
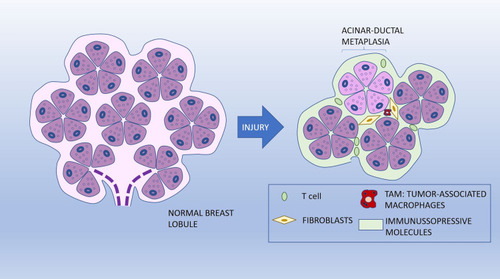
Figure 12 The proposed theory of cell dysplasia induction as a result of silicone bleeding.
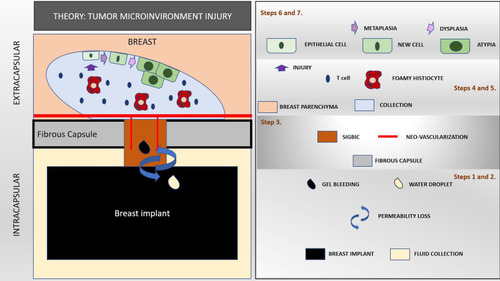
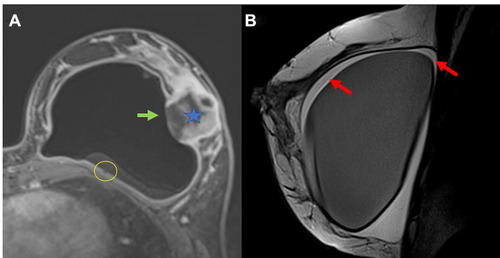
Figure 13 (A and B) Another example of undifferentiated breast carcinoma (blue star). There is a communication between the intracapsular space to the breast tumor. A discontinuity of the fibrous capsule is observed (green arrow). There is also the black-drop signal in fibrous capsule (yellow circle) (A). The red arrow show intracapsular fluid collection with septa inferring fibrin content (B).