Figures & data
Figure 1 Cancer treatment-induced bone loss.Citation44,Citation45,Citation88–Citation90
Abbreviations: AI, aromatase inhibitor; BMD, bone mineral density; GnRH, gonadotropin-releasing hormone; PMw, postmenopausal women.
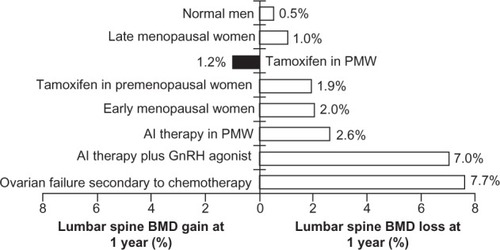
Table 1 Bone-related and fracture-related adverse events from aromatase inhibitor (AI) trialsCitation5,Citation18,Citation22,Citation31,Citation62
Figure 2 Left femur bone mass density over time. (A) At baseline, (B) at 12 months, and (C) at 24 months.
Note: Bone scans provided by authors.
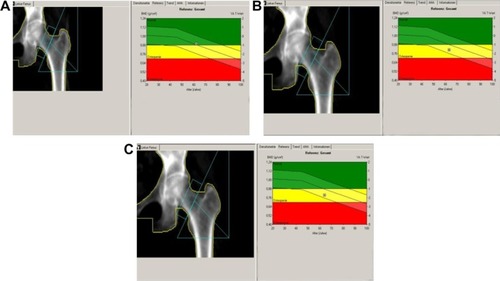
Figure 3 Right femur bone mass density over time. (A) At baseline, (B) at 12 months, and (C) at 24 months.
Note: Bone scans provided by authors.
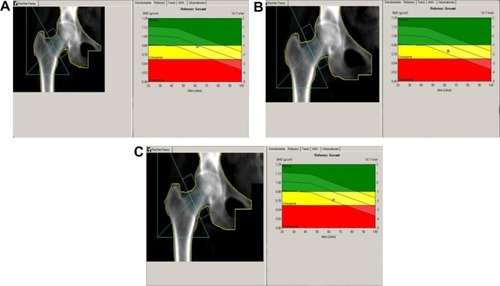
Figure 4 Lumbar spine bone mass density over time. (A) At baseline, (B) at 12 months, and (C) at 24 months.
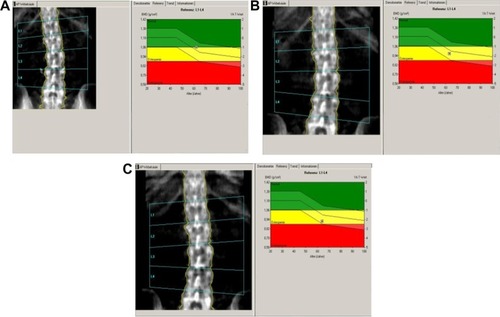
Table 2 Dual-energy X-ray absorptiometry (DXA) and quantitative ultrasound (QUS) results
Table 3 Disease-free survival (DFS) events and deathsTable Footnotea