
Figures & data
Figure 1 Microscopy of histological sections from breasts of mother rats among the groups. (A and B) MNU; (C and D) A. muricata; (E and F) MNU and BV; (G and H) MNU, A. muricata, and BV.
Abbreviations: Al, alveoli; BV, blood vessel; CT, connective tissue; D, duct; Du, ductules; FC, fat cell; Lo, lobule; V, vacuoles.
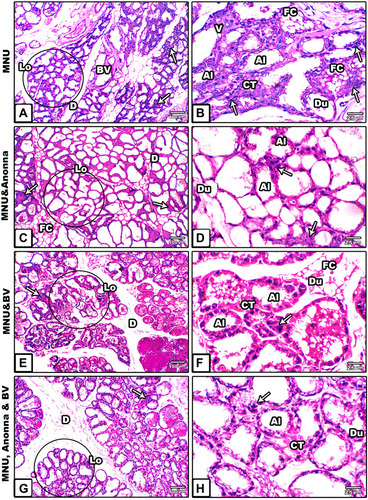
Figure 2 Microscopy of histological sections from ovaries of mother rats among the groups. (A and B) MNU; (C and (D) MNU and A. muricata; (E and F) MNU and BV; (G and H) MNU, A. muricata, and BV.
Abbreviations: A, antrum; AF, atretic follicle; BV, blood vessel; CL, corpus luteum; H, hemorrhage; GC, granulosa cells; GF, Graafian follicle; O, ovum; PF, primary follicle; St, stroma; V, vacuoles.
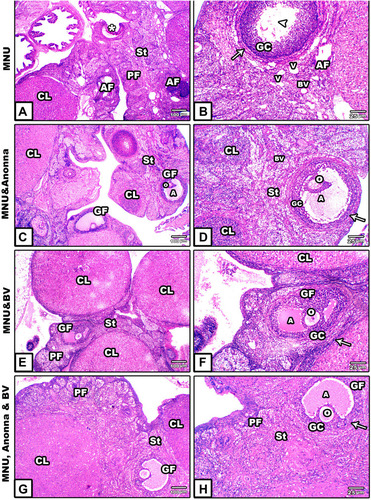
Figure 3 Microscopy of histological sections of ovaries of 21-day offspring among the groups. (A) MNU; (B) MNU and A. muricata; (C) MNU and BV; (D) MNU, A. muricata, and BV. The ovarian section in A) displays ovary shrinkage, with increased number of atretic primary follicles, and disintegrated germinal epithelium; (B–D) Remarkable restoration in damaged histological structures induced by MNU despite very few atretic follicles still apparent. Arrows, thecae externa.
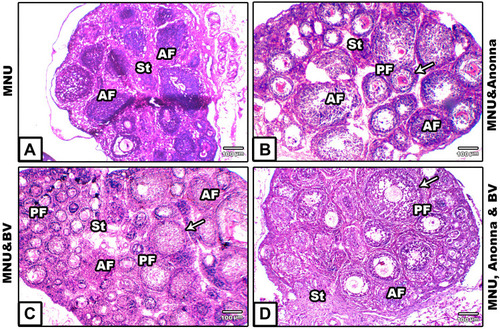
Figure 4 Microscopy of paraffin-embedded sections of breast stained with anti-p53 antibody. (A) MNU; (B) MNU and A. muricata; (C) MNU and BV; (D) MNU, A. muricata, and BV.
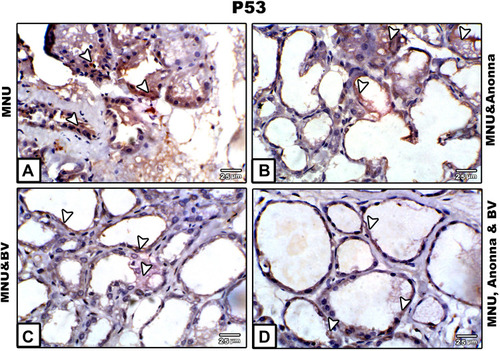
Figure 5 Microscopy of paraffin-embedded sections of mothers' ovaries (A–D) and their offspring (A1–D1) stained with anticalretinin antibody. Ovarian tissue shows a strong positive reaction for calretinin protein in MNU-induced mother rats (A), moderate to weak reaction in graviola juice–supplemented mothers (B), weak to negative calretinin reaction in BV-treated mothers (C), and moderate to weak calretinin expression in A. muricata juice plus BV–treated mothers (D). Ovarian sections of offspring displayed moderate calretinin expression in MNU-induced group (A1), weak calretinin reactivity in A. muricata juice or BV (B1 and C1), respectively, and very weak or negative calretinin expression in A. muricata juice and BV–supplemented offspring (D1). Arrowheads indicate immunoreactivity of calretinin.
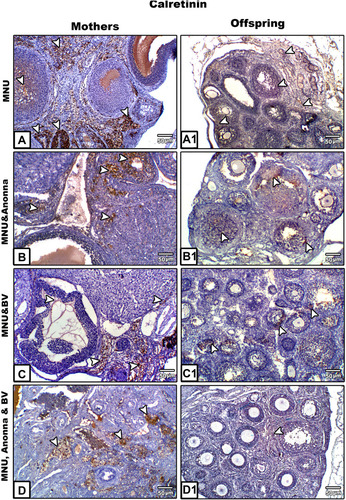
Figure 6 Levels of serum MMP1, NFκB, TNFα and caspase 3 in mother rats and their 21-day offspring among groups. A: The level of serum MMP-1 appears significantly lower in Graviola and/or BV treated mother rats, however this level appears significantly higher in Graviola supplemented offspring if compared with maternally MNU-induced offspring. B and C: A significant decrease in the levels of serum NF-κB and TNF-α in Graviola and/or BV supplemented mother rats and their offspring if compared with MNU-treated group. D: Significant increase in the levels of serum caspase 3 in in Graviola or BV supplemented mother rats and their offspring, however in Graviola and BV supplemented mother rats the level of caspase 3 appears with non-significant change but their offspring display significant increase compared with MNU-treated group.
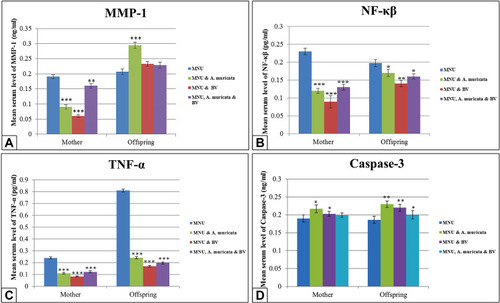
Figure 7 Levels of serum MDA, CAT, and SOD in mothers and 21 day offspring among groups. Images A and C show lowly significant decrease of serum MDA levels and highly significant increase in the levels of SOD in Graviola juice and/or BV supplemented mother rats and their offspring (P<0.001) if compared with the MNU-induced group. Image B shows higly significant increase in the levels of CAT in Graviola juice and/or BV supplemented mother rats (P< 0.001), however the offspring display no significant difference (P>0.05) with Graviola alone and significant increase with BV alone or in combination with Graviola (P<0.001) in comparison with MNU-induced group.
