Figures & data
Figure 1 Chemical structure of wortmannin.
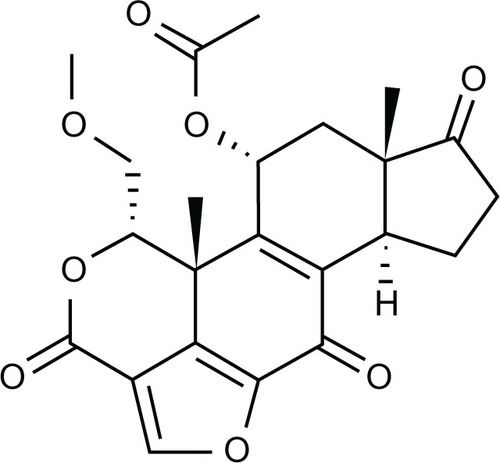
Figure 2 Cell death determination by Trypan blue exclusion assay.
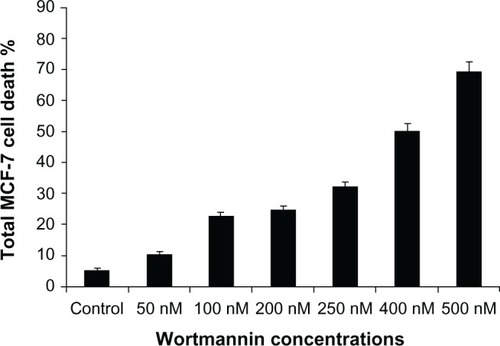
Figure 3 Phase-contrast micrographs of wortmannin treated MCF-7 cells incubated for 24 hours.
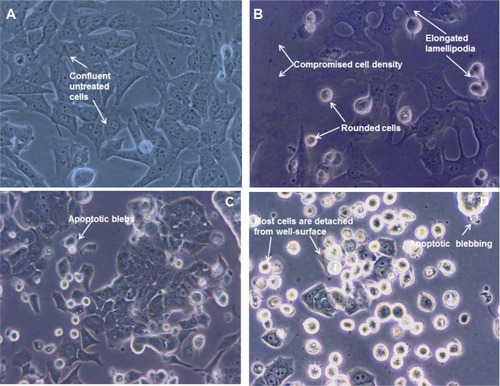
Figure 4 Fluorescence micrographs of MCF-7 cells treated with different concentrations of wortmannin and stained with acridine orange and ethidium bromide. Viable cells show green fluorescence and apoptotic cells show dark orange or red fluorescence. (A) Control cells not treated with wortmannin, and treated with wortmannin (B) 500 nM, (C) 1 μM, and (D) 5 μM for 24 hours.
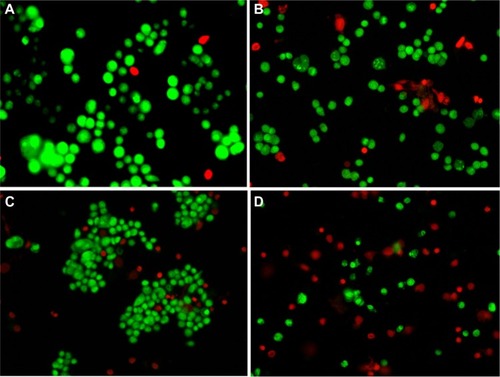
Figure 5 Representative phase-contrast micrographs of qualitative MTT assay. (A) Control cells and those treated with wortmannin (B) 500 nM, (C) 1 μM, (D) 2 μM, and (E) 4 μM, for 24 hours.
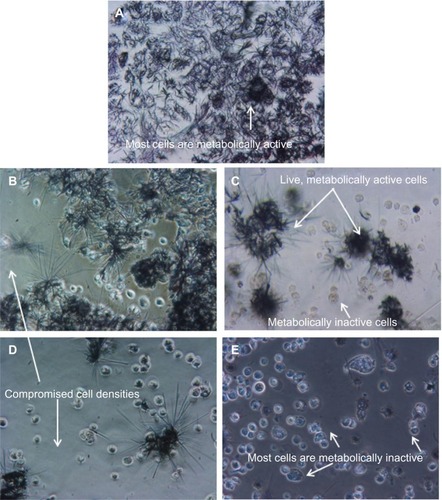
Figure 6 Flow cytometric dot plots showing status of wortmannin-induced apoptosis in MCF-7 cells. Yo-PRO®-1 and propidium iodide (Life Technologies, Carlsbad, CA) were used to stain the cells for FACS analysis. (A) Control cells (without wortmannin), and cells incubated with wortmannin at concentrations of (B) 50 nM, (C) 200 nM, (D) 500 nM, (E) 1 μM, and (F) 2 μM for 24 hours.
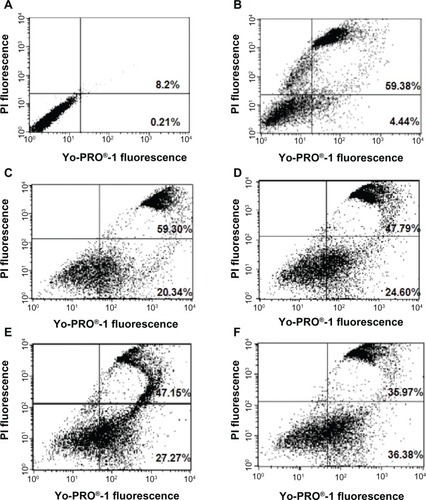
Figure 7 Wortmannin-treated MCF-7 cells demonstrating chromatin condensation effect. Representative nuclear staining of MCF-7 cells with Hoechst 33342. Changes in cellular nuclear morphology examined using fluorescence microscopy and a DAPI filter. (A) Control cells uniformly stained blue without condensed chromatin, with normal, round, and unpunctuated nucleus (blue arrow), recorded as nonapoptotic cells. (B–D) Cells with condensed and fragmented nuclei. Wortmannin-treated cells (B) show nuclear shrinkage, and chromatin and DNA condensation (white arrow), nuclear fragmentation with brighter blue-whitish (red arrow) fluorescent appearance compared with control, and were scored as apoptotic cells. (C) Percentage of chromatin condensation increases with higher concentrations of wortmannin. (D) Nuclear fragmentation in higher magnification.
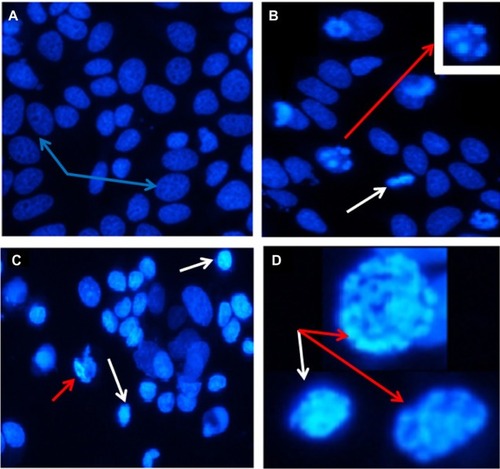
Figure 8 Phase-contrast micrographs of wortmannin-treated MCF-7 cells showing typical apoptotic morphological changes, eg, rounded, shrunken, and suspended cells, with apoptotic blebbing. (A and B) are representative of cells treated with wortmannin for 24 hours.
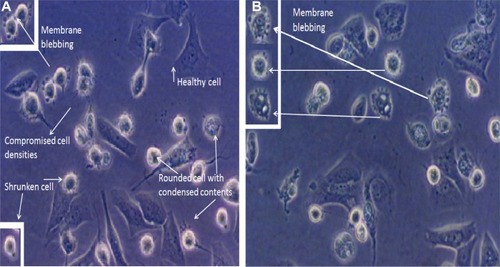
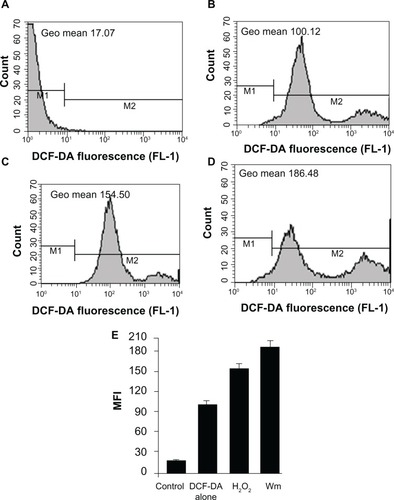
Figure 9 Intracellular accumulation of reactive oxygen species in MCF-7 cell lines. The x axis shows the fluorescent intensity of DCF-DA oxidation, and the y axis indicates cell numbers. (D) Histograms showing representative results of wortmannin-treated cells compared with untreated control cells (A and B). (C) H2O2 positive control. (E) Bar graph showing the percentage of cells from both groups (treated and not treated with wortmannin) with mean fluorescence intensity.