Figures & data
Table 1 Descriptive characteristics of newly diagnosed breast microcalcifications by BI-RADS scores
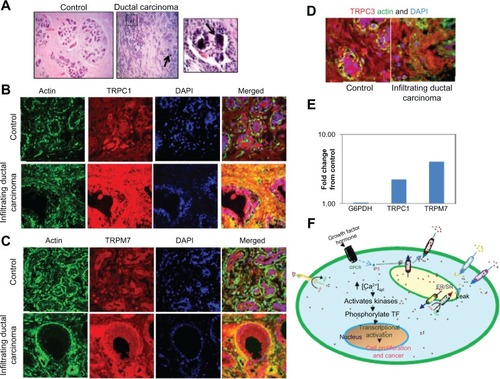
Figure 1 TRPC1 and TRPM7 expression is increased in infiltrating ductal carcinomas. Hematoxylin and eosin staining of control and ductal carcinoma samples. Respective images were taken at 10× zoom; microcalcification has been shown with an arrow, and also a magnified image showing microcalcification is provided on the right (A). Confocal images showing endogenous TRPC1 (B), TRPM7 (C), TRPC3 (D), and actin staining in age-matched controls (without cancer or microcalcifications) and infiltrating ductal carcinoma samples with microcalcifications were observed. Anti-TRPC1, Anti-TRPC3, or Anti-TRPM7 antibodies followed by rhodamine-conjugated secondary antibodies were used to detect endogenous TRPC1, TRPC3, and TRPM7 protein. Antiactin antibodies followed by FITC-labeled secondary antibodies were used to detect actin levels. The images provided are from at least two to three individual sections, and total fluorescence was evaluated using the Zeiss software (Carl Zeiss Microscopy, LLC, Thornwood, NY, USA). Fold change in the expression of G6PDH, TRPC1, and TRPM7 in controls, as well as breast cancer samples were observed (E). A model for the activation of various channels and their role in increasing cytosolic calcium that leads to cancer is shown (F).