Figures & data
Table 1 The Primer Sequences
Table 2 Correlation Between Circ_0007823 Levels and TNBC Clinical Indicators
Figure 1 Expression of hsa_circ_0007823 in clinical samples of triple negative breast cancer (TNBC). (A) Quantitative real time polymerase chain reaction (qRT-PCR) analysis of the expression of hsa_circ_0007823 in 30 pairs of TNBC and adjacent normal tissues. (B) Analysis of hsa_circ_0007823 expression in patients with TNBC with or without lymph node metastasis. Kaplan–Meier survival curves of overall survival (C) and disease-free survival (D) of patients with TNBC with low and high hsa_circ_0007823 expression. The median hsa_circ_0007823 value was used as the cutoff. **P < 0.01, ***P < 0.001.
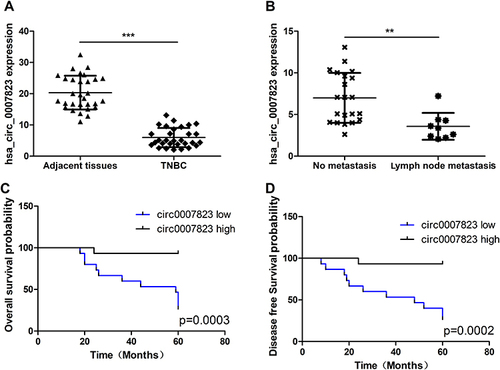
Figure 2 Interaction among hsa_circ_0007823, miR-182-5p and FOXO1. (A) The relationship between hsa_circ_0007823, and miR-182-5p using dual luciferase reporter gene assay. (B) The relationship between miR-182-5p and FOXO1 using dual-luciferase reporter gene assay. *P < 0.05, ***P < 0.001.
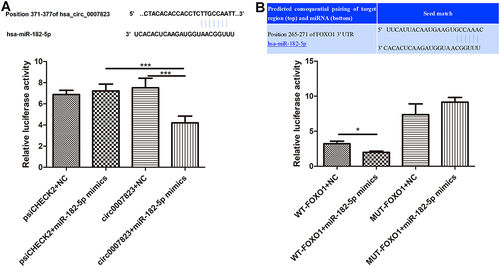
Figure 3 Expression of hsa_circ_0007823 in TNBC cell lines, and effects of hsa_circ_0007823 on the viability and apoptosis of TNBC cell lines. (A) The expression of hsa_circ_0007823 in the TNBC cell lines (MDA-MB-231, MDA-MB-468, and BT549). *P < 0.05, **P < 0.01 vs MCF10A. (B) Cell transfection efficiency of TNBC cell lines after transfected with OE-circ_0007823 by determining circ_0007823 expression using qRT-PCR. **P < 0.01, vs NC. Effects of circ_0007823 on the viability (C) and apoptosis (D) of TNBC cell lines using cell counting kit-8 and flow cytometry. *P < 0.05, **P < 0.01, vs NC.
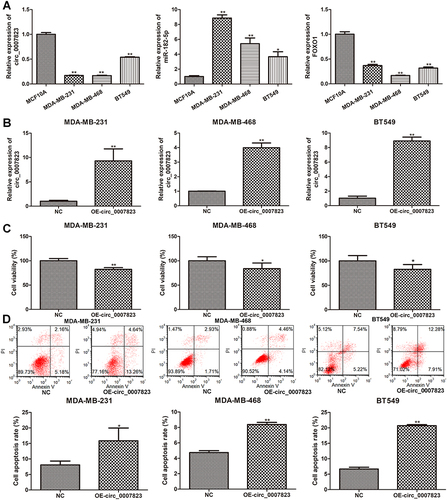
Figure 4 Effects of hsa_circ_0007823 on the invasion and migration of TNBC cell lines. (A) The invasion of TNBC cell lines after transfection with OE-circ_0007823 using Transwell. The migration of TNBC cell lines after transfected with OE-circ_0007823 using Transwell (B) and scratch test (C). *P < 0.05, **P < 0.01, vs NC. The scale bar for MDA-MB-231 cells was 100 μm; as well as the scale bar for MDA-MB-468 and BT549 was 50 μm.
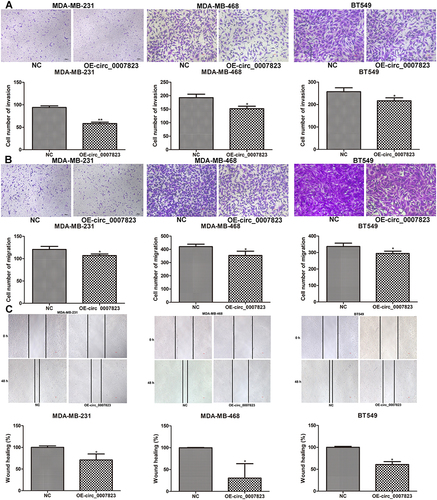
Figure 5 Expression of FOXO1 in the TNBC cell lines transfected with miR-182-5p inhibitor. (A) Cell transfection efficiency of TNBC cell lines after transfection with miR-182-5p inhibitor by determining miR-182-5p level using qRT-PCR. The mRNA expression (B) and protein expression (C) of FOXO1 in the TNBC cell lines after transfection using qRT-PCR and Western blot. *P < 0.05, **P < 0.01, vs NC inhibitor.
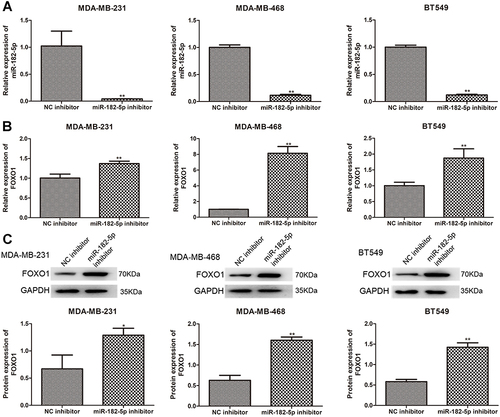
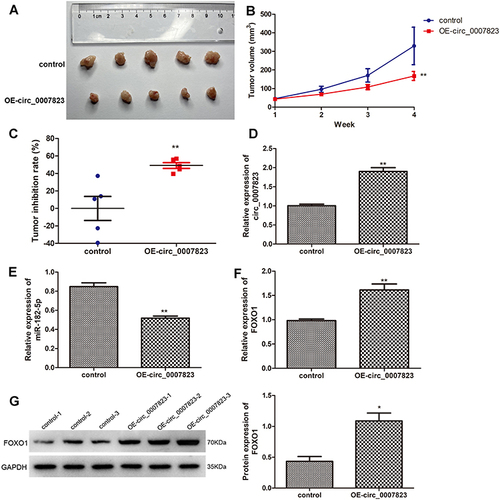
Figure 6 Overexpression of hsa_circ_0007823 inhibited the growth of TNBC tumor. (A) The tumor size of each mouse in the different groups. (B) The changes of tumor volume with the increase of feeding time. (C) Tumor inhibition rate of the mice in the different groups. The expression levels of circ_0007823 (D), miR-182-5p (E), and FOXO1 (F) in the tumor samples of each group using qRT-PCR. (G) The protein expression of FOXO1 in the tumor samples of each group by Western blot. *P < 0.05, **P < 0.01, vs control.