Figures & data
Table 1 Distribution of Cases According to Molecular Subtypes and Prognostic Factors
Figure 1 Lipocalin 2 (LCN2) staining scored with the Allred scoring in different breast cancerous tissues. (a) Cytoplasmic staining with Allred score 1 in ductus epithelium and stroma of normal breast tissue (blue arrow), (b) Cytoplasmic and membranous staining with Allred score 3 in tumor cells in a case with Luminal A, (c) Allred score 4 in tumor cells in a case with Luminal A, (d) Allred score 5 in tumor cells in a case with Luminal B, (e) Allred score 6 in tumor cells in a case with Luminal B, (f) Allred score 7 in a case with TNBC, (g) Allred score 8 LNC2 expression in a case with tumor cells of TNBC, (h) LCN2 positive control (colon adenocarcinoma). All figures are at 100 µm magnification.
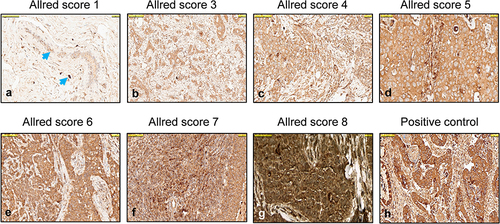
Table 2 Distribution of Cases into Molecular Subtypes and Prognostic Factors According to LCN2 Expression by Allred Score
Table 3 Comparison of LCN2 Allred Score Expressions in Molecular Subtypes and Prognostic Factors Based on Positive versus Negative Status Among All Cases
Table 4 Distribution of Cases into Molecular Subtypes and Prognostic Factors According to PD-L1 Expression Based on CPS Cut-Offs
Table 5 Distribution of Cases into Molecular Subtypes and Prognostic Factors According to PD-L1 Expression
Figure 2 PD-L1 staining scored with CPS. Representative CPS score (CPS 80) of the same area in a TNBC tumor, (a) H&E staining 500 µm and 100 µm in inlet, (b) PD-L1 staining 500 µm and 100 µm in inlet, (c) Tonsil tissue PD-L1 positive control, (d) Normal breast tissue PD-L1 negative control.
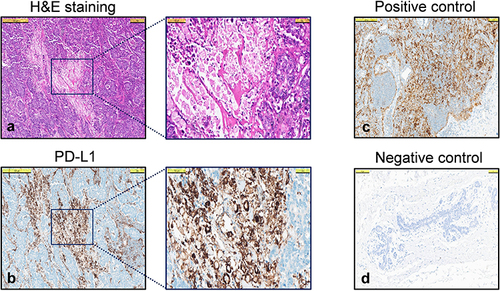
Table 6 Association of LCN2 and PD-L1 Staining Scores with Prognostic Factors and Molecular Subtypes
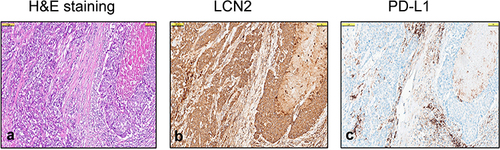
Figure 3 Expression of LCN2 and PD-L1 in Triple-Negative Breast Cancer (TNBC). (a) Representative H&E staining of TNBC, (b) LCN2 staining of tumor cells (Allred score 7 with cytoplasmic staining of the same area in a, (c) PD-L1 staining in tumor cells and lymphocytes (CPS 50, same area in (a and b). All figures are at 100 µm magnification.