Figures & data
Figure 1 Effects of single agent AZD1152 at increasing concentrations on colony formation in TNBC cell lines. Dose response curves were generated for AZD1152 in studied cell lines. IC50 values were determined using a nonlinear regression model in GraphPad Prism software.
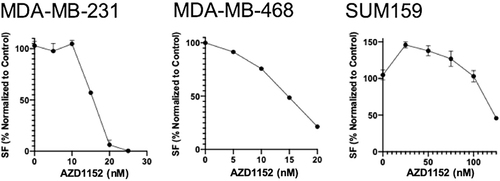
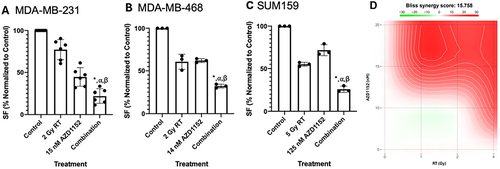
Figure 2 Effects of AZD1152 in combination with RT in TNBC cell lines. Combination treatment of (A) MDA-MB-231; (B) MDA-MB-468; (C) SUM159 cells with a single concentration of AZD1152 and a single dose of RT. Treatment with RT or AZD1152 alone results in reduced colony formation with further significant reduction of proliferation by a combination treatment relative to single agent treatment (p≤0.05 compared to control (*), RT only (⍺) or (β) AZD1152 only treatment); (D) Synergy plot using various concentrations of AZD1152 and doses of RT in MDA-MB-231 cells using SynergyFinder, where the intensity of red indicates a higher degree of synergy (n = 3).