Figures & data
Table 1 Mammography screening in Iceland
Figure 1 Invasive breast cancer in Iceland.
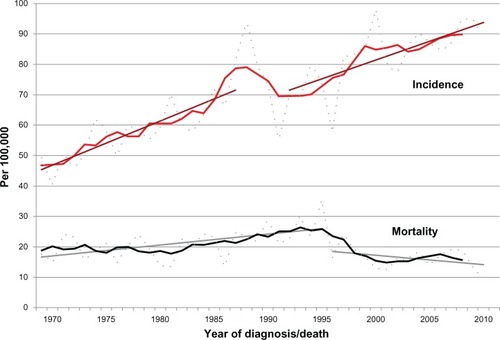
Figure 2 Invasive breast cancer in Iceland. (A) Age-specific incidence and mortality rates per 100,000 at age 40–49, with 5-year moving average rates. Linear regression lines for the incidence trends between 1969–1987 and 1992–2010 and for the mortality trends between 1969–1995 and from that point to 2010 in the respective age groups. (B) Age-specific incidence and mortality rates per 100,000 at age 50–69 with 5-year moving average rates. Linear regression lines for the incidence trends between 1969–1987 and 1992–2010 and for the mortality trends between 1969–1995 and from that point to 2010 in the respective age groups. (C) Age-specific incidence and mortality rates per 100,000 at age 70–79 with 5-year moving average rates.
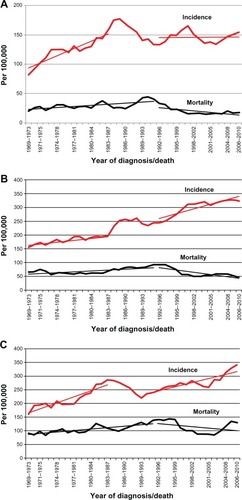
Table 2 Distribution of risk factors and disease specific death rates according to mode of cancer detection 1988–2009
Table 3 The likelihood of dying from breast cancer