
Figures & data
Figure 1 Flowchart of the sampling procedure used to select the population, Ethiopia’s Amhara region, 2016 (n= 632).
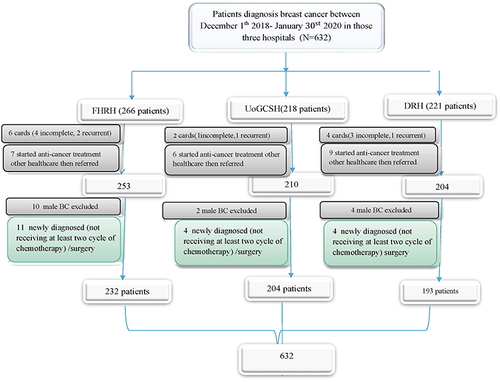
Table 1 Felege Hiwot Referral Hospital Survival Classification for Socio-Demographic Covariates
Table 2 University of Gondar Comprehensive Specialized Hospital Survival Classification for Socio-Demographic Covariates
Table 3 Dessie Referral Hospital Survival Classification for Socio-Demographic Covariates
Table 4 Felege Hiwot Referral Hospital Survival Classification for Clinical, Histologic, and Treatment Covariates
Table 5 University of Gondar Comprehensive Specialized Hospital Survival Classification for Clinical, Histologic, and Treatment Covariates
Table 6 Dessie Referral Hospital Survival Classification for Clinical, Histologic, and Treatment Covariates
Figure 2 Classification of breast cancer survival proportions by hospital.
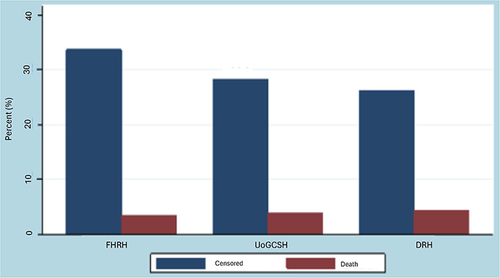
Figure 3 Kaplan–Meier estimator survival probability of the three hospitals.
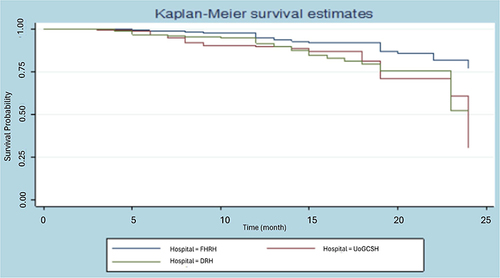
Table 7 Test of Equality of Survivor Function Between Three Hospitals
Figure 4 Hospital wise survival classification.
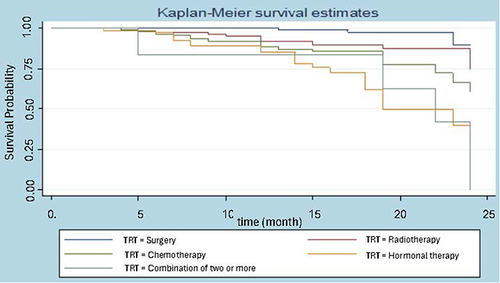
Figure 5 (A) and (B) The Kaplan-Meier survival curves for age and Tumor Size categories.
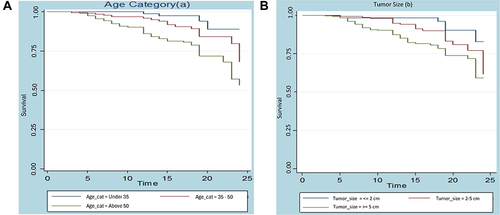
Figure 6 (A) and (B) The Kaplan-Meier survival curves for histologic grade and lymph node status.
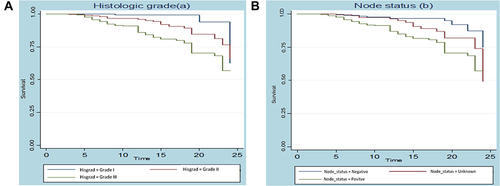
Figure 7 (A) and (B) The Kaplan-Meier survival curves for stages and comorbidity.
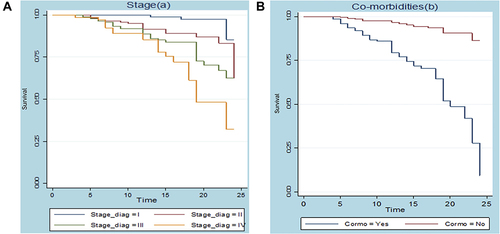
Table 8 The Value of AIC and BIC for Multivariable Parametric Shared Frailty Models
Table 9 Comparison of AFT Models Using AIC Criteria
Table 10 Summary Results of the Final Log-Normal AFT Model
Table 11 Summary Result for the Final Log-Normal Inverse-Gaussian Frailty Models
Data Sharing Statement
The datasets used and/or analysed during the current study are available from the corresponding author on reasonable request.