Figures & data
Figure 1 Flow diagram of this study.
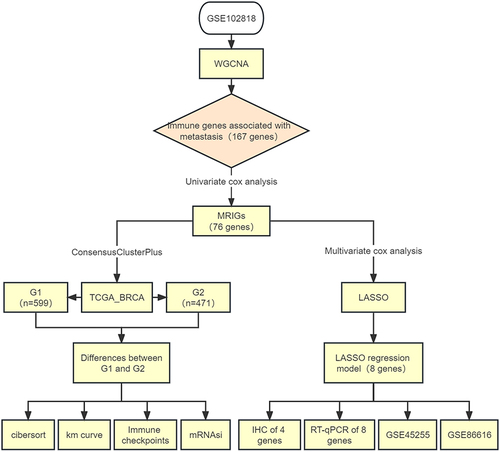
Figure 2 Construction of weighted gene co-expression network and identification of significant modules in weighted gene co-expression network analysis. (A) Cluster dendrogram of 48 breast cancer samples. (B) The scale-free fit index for soft threshold powers. Left: the relationship between the soft threshold and scale-free R2. Right: the relationship between the soft threshold and mean connectivity. Different modules were labeled in different colors. (C) Cluster dendrogram and module assignment of weighted gene co-expression network analysis. The branches referred to clusters of genes highly connected. The colors in the horizontal bar represented the modules. (D) Heatmap of the correlation between module genes and disease status. Each cell contained the correlation coefficients and p value. Red indicated positive correlations while blue indicated negative. (E) Module memberships in turquoise module and their correlation with metastasis (cor represented correlation coefficient).
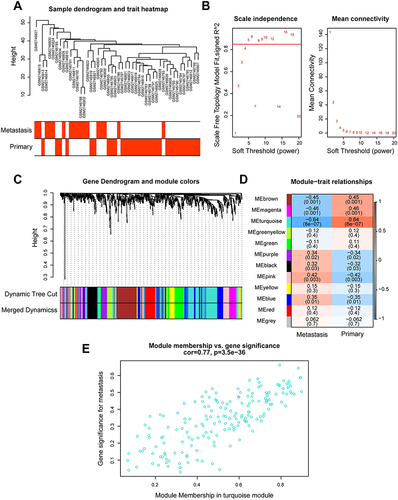
Figure 3 Functional annotations of metastasis-related immune genes. (A) The expression levels of 76 genes in The Cancer Genome Atlas-Breast Cancer datasets. Red indicated up-regulated genes; blue indicated down-regulated genes. (B) Metascape website analysis. Nodes with the same cluster ID were typically close to each other, and the same color indicated the same cluster ID. (C) The top twelve Gene Ontology functional analysis results. (D) The top five Kyoto Encyclopedia of Genes and Genomes analysis results. (E and F) Identification of subnet modules from the protein protein interaction network with the Cytohubba and MCODE (MCODE score = 16.316) algorithm.
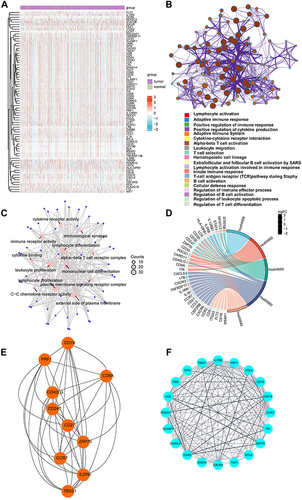
Figure 4 Metastasis-related immune gene subtype characteristics of two distinct subtypes of samples divided by consistent clustering. (A) Correlation between the 76 genes. (B) Consensus matrix heatmap defining two clusters (k = 2) and their correlation areas. (C) Survival analyses for two distinct subtypes in The Cancer Genome Atlas-Breast Cancer cohort using Kaplan Meier curves. (Log rank test, p = 0.0145). (D) Hierarchical clustering of metastasis-related immune genes in The Cancer Genome Atlas-Breast Cancer cohorts. Hierarchical clustering was performed with Euclidean distance and Ward linkage. The cluster was shown as annotations. Rows represented metastasis-related immune genes, and columns represented breast cancer samples. Red represented high expression and blue represented low expression of each gene. (E) Principal component analysis showing a remarkable difference in transcriptomes between the two subtypes.
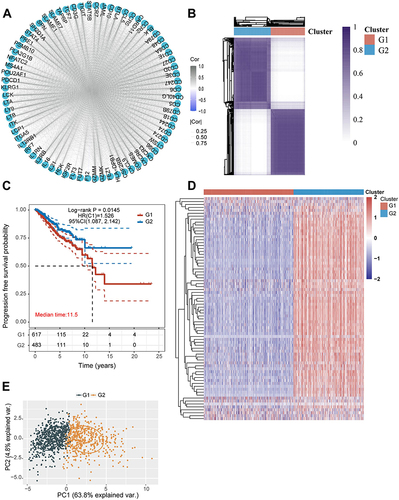
Figure 5 The differences between the metastasis-related immune gene subtypes. (A) Differences in mRNA expression-based stemness index score between the two different MRIGS groups. (B) The heatmap of the expression of immune checkpoint genes in the signature in two metastasis-related immune gene subtypes. (C) Differences in the Tumor Immune Dysfunction and Exclusion score among different metastasis-related immune gene groups. (D) The bar plot for the proportion of twenty-two infiltrating immune cells based on the CIBERSORT algorithm in the Tumor Immune Dysfunction and Exclusion datasets. (E) The heatmap of twenty-two infiltrating immune cell types in the two metastasis-related immune gene subtypes. (F–I) Correlations between the two metastasis-related immune gene subtypes and tumor microenvironment score (Tumor microenvironment score included ESTIMATE score, immune score, stromal score and tumor purity) (*P < 0.05; ***P < 0.001; ****P < 0.0001).
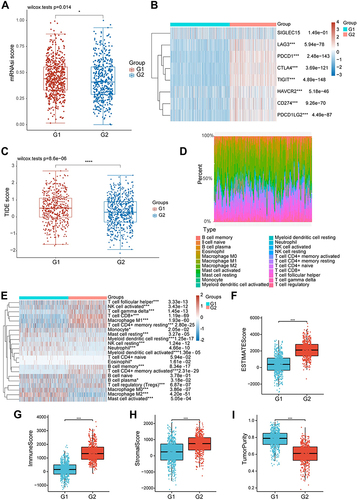
Figure 6 Construction of the metastasis-related immune genes_score in the training set. (A) Forest map of multivariate survival analysis. (B) LASSO regression curves where each curve represented one gene. (C and D) Ranked dot and scatter plots showing the metastasis-related immune genes_score distribution and patient progression status. (E) Relationships between the expression of eight signature genes and metastasis-related immune genes_score. (F) Sankey diagram of subtype distributions in groups with different metastasis-related immune genes_score and progression outcomes.
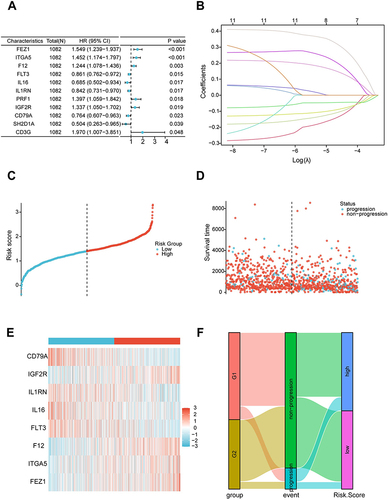
Figure 7 Prognostic value and features of LASSO regression model in the training set. (A) Kaplan-Meier survival curve in the training set. The red line represented the high-risk group, and the blue line represented the low-risk group. (B) The area under the curve of time-dependent receiver operating characteristics curve analysis for evaluating the prognostic performance of the risk score for 1,2,4-year progression-free survival of the training set. (C) Expression of eight signature genes in The Cancer Genome Atlas-Breast Cancer cohort. (D) Correlation between the eight signature genes. (E) Mutation profile analysis of signature genes by using The Cancer Genome Atlas datasets. (F) Correlation between gene expression and the sensitivity of Genomics of Drug Sensitivity in Cancer drugs. (*P < 0.05; **P < 0.01; ***P < 0.001).
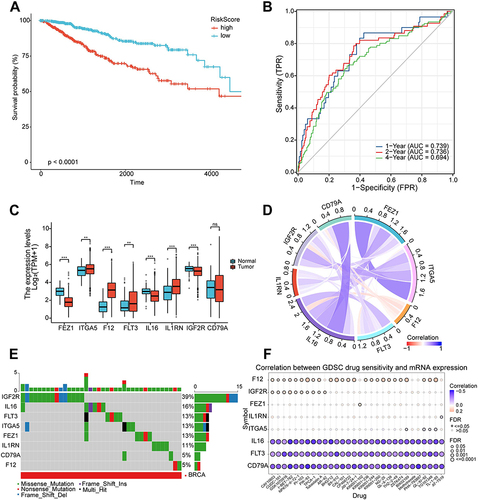
Figure 8 Validation and application of the prognostic risk model. (A) Kaplan-Meier survival curve in the validation set. (B) The area under the curve of time-dependent receiver operating characteristics curve analysis for evaluating the prognostic performance of the risk score for 1,2,4-year progression-free survival of the training set. (C) Nomogram for predicting the 1-, 2-, 4-year progression-free survival of metastasis-related immune genes_patients in the validation set. (D) Calibration curves of the nomogram for predicting of 1-, 2- and 4-year progression-free survival of the validation set. (E) Decision curve analysis based on validation set. (F) Kaplan-Meier survival curve in the testing set. (G) The area under the curve of time-dependent ROC curve analysis for evaluating the prognostic performance of the risk score for 1,2,4-year progression-free survival of the testing set. (H) Nomogram for predicting the 1-, 2-, 4-year progression-free survival of metastasis-related immune gene patients in the testing set. (I) Calibration curves of the nomogram for predicting of 1-, 2- and 4-year progression-free survival of the testing set. (J) Decision curve analysis based on testing set.
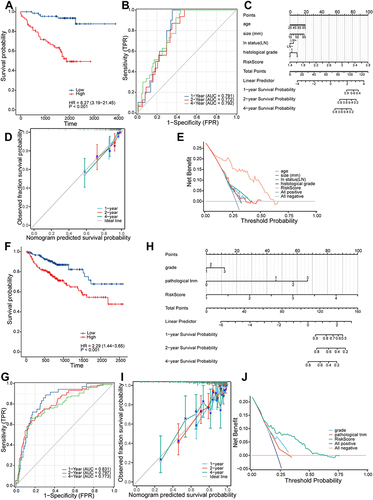
Figure 9 Validation of reverse transcription-quantitative polymerase chain reaction using primary (n = 12) breast cancer tissue samples and metastasis breast cancer tissue (n = 12) samples. (A–H) The mRNA expression of eight signature genes (FEZ1, ITGA5, F12, FLT3, IL16, IL1RN, IGF2R and CD79A) were confirmed by reverse transcription-quantitative polymerase chain reaction. (**P < 0.01).
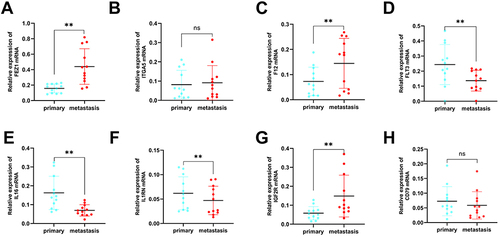
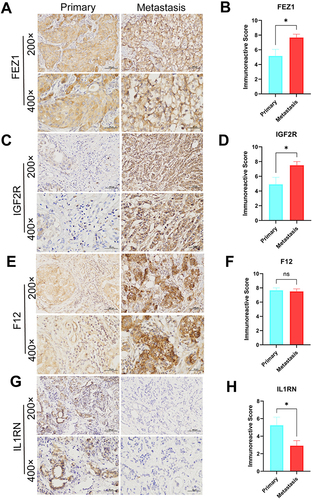
Figure 10 Expression levels of FEZ1, F12, IGF2R and IL1RN in breast cancers by IHC. (A, C, E and G) Expression of FEZ1, F12, IGF2R and IL1RN, respectively in primary (n = 12) and metastasis (n = 12) breast cancer tissue (SPx400). (B, D, F and H) Typical IHC images obtained at a 400× magnification together with IRS were used for analyzing the IHC results of FEZ1, F12, IGF2R and IL1RN, respectively, in primary breast cancer (n = 12) and metastasis (n = 12) samples. (mean ± SEM, *P < 0.05).