Figures & data
Table 1 Correlation Between Baseline sHER2 Levels with Clinicopathological Characteristics in Patients with Advanced Breast Cancer
Table 2 Correlation Between Baseline sHER2 Level and Therapeutic Efficacy
Figure 1 Correlation of baseline sHER2 levels and prognosis (time to progression, TTP) in patients with advanced breast cancer. (A) Comparison of TTP between baseline sHER2 high level group and sHER2 low level group (p=0.048). Comparison of TTP between tHER2 positive patients and tHER2 negative patients in sHER2 high level group (B, p=0.142), and sHER2 low level group (C, p=0.059). Comparison of TTP between the sHER2 high level group and the sHER2 low level group in tHER2 positive patients (D, p=0.024) and negative patients (E, p=0.251).
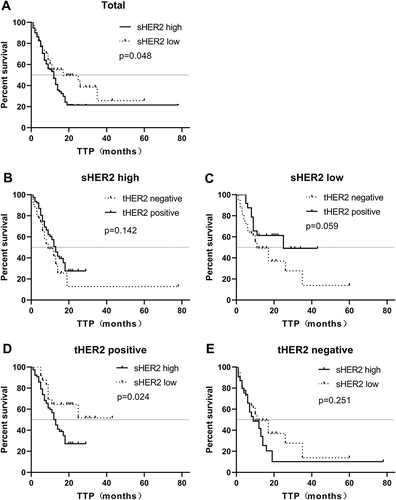
Table 3 Correlation Between the Change of sHER2 Level and Therapeutic Efficacy in Baseline sHER2 High Level and Low Level Group After Two Treatment Cycles
Figure 2 Correlation between the change of sHER2 level and prognosis (TTP) after two cycles of treatment. (A) Comparison of TTP between the significant decrease group, no significant change group, and significant increase group after two cycles of treatment. The comparison of TTP of three groups in the sHER2 high level group (B) and sHER2 low level group (C), respectively. The comparison of TTP of three groups in the tHER2 positive group (D) and tHER2 negative group (E), respectively.
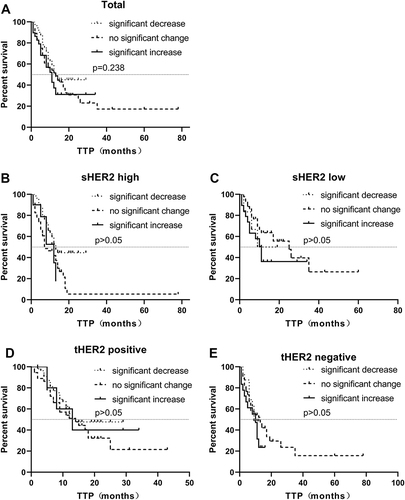
Table 4 Correlation Between the Change of sHER2 Level and Therapeutic Efficacy in Baseline sHER2 High Level and Low Level Group After Multi Cycles of Treatment
Figure 3 Correlation between the change of sHER2 level and prognosis (TTP) after multiple cycles of treatment. Comparison of TTP between the decrease to negative group and continuous positive group in patients with baseline sHER2 high level (A, p=0.01). Comparison of TTP between the decrease to negative group and continuous positive group in tHER2 positive group (B, p=0.006) and in the tHER2 negative group (C, p=0.684). Comparison of TTP between the continuous negative group and increase to positive group in patients with baseline sHER2 low level (D, p=0.03). Comparison of TTP between the continuous negative group and increase to positive group (E, p=0.055) in the tHER2 positive group and tHER2 negative group (F, p=0.132).
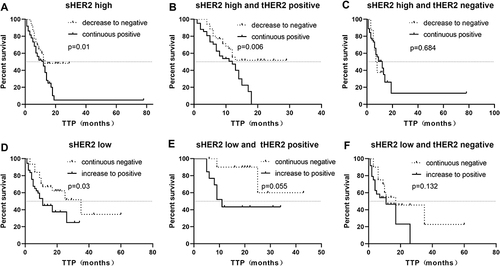
Figure 4 Typical examples of sHER2 dynamic change curve: (A) rapid decline type; (B) stable type; (C) fluctuating type; (D) slow ascending type; (E) slow descending type; (F) spoon type. The ordinate is the value of sHER2 (ng/mL).
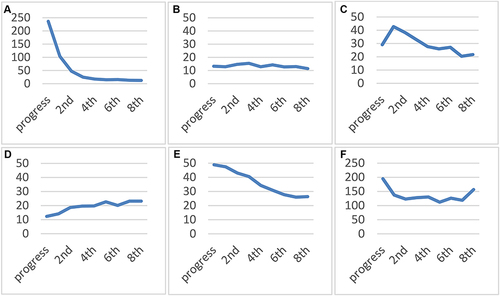
Table 5 Clinicopathological Characteristics of Patients and Therapeutic Efficacy in Different Types of sHER2 Dynamic Change Curve
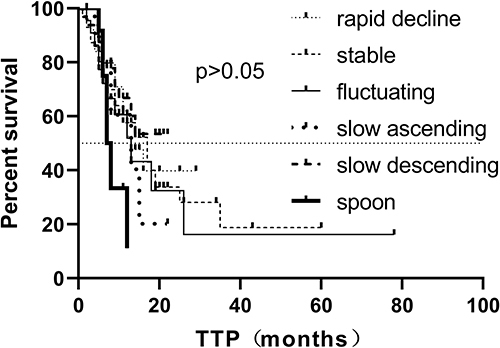
Figure 5 Comparison of prognosis (time to progression, TTP) between different sHER2 dynamic change curves. Pairwise comparison of different curve types found that the TTP of patients in the spoon group was shorter than that of the rapid decline type, stable type, and slow descending type (p=0.028, 0.038, and 0.007, respectively).