Figures & data
Figure 1 The different expression of Ki-67 in breast cancer of tumor tissues. ((A) 5%; (B) 20%; (C) 30%; (D) 60%; SP x400).
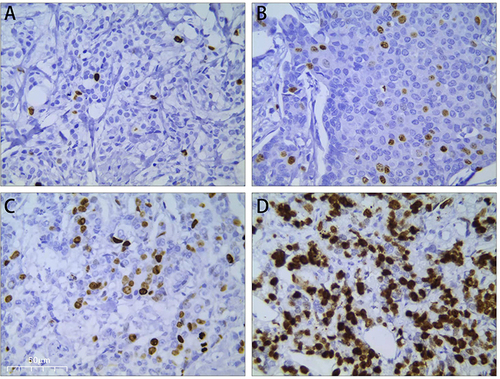
Figure 2 The frequency distribution of Ki-67 value in 2015–2019.
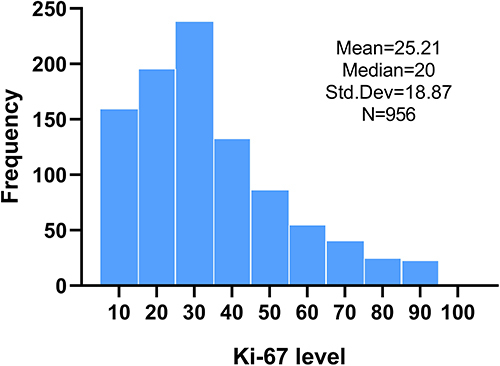
Table 1 HR+/HER2- Breast Cancer at Different Cut-off Values
Table 2 Correlation of Ki-67 with Pathological for the Different Cut-off Values
Figure 3 The ROC curve of Ki-67 expression (Area under ROC curve: 0.689; Sensitivity: 63.02%; Specificity: 65.57%; Youden Index: 0.286; 95% CI: [0.626–0.754]; P <0.001;).
![Figure 3 The ROC curve of Ki-67 expression (Area under ROC curve: 0.689; Sensitivity: 63.02%; Specificity: 65.57%; Youden Index: 0.286; 95% CI: [0.626–0.754]; P <0.001;).](/cms/asset/a813db46-b514-4f92-94e6-b6bfc201f007/dbct_a_12301112_f0003_c.jpg)
Figure 4 The relationship between Ki-67 expression and histological grade. (Median: G1:10%; G2:20%; G3:40%. Mean: G1:13%; G2:23%; G3:39%, P <0.001).
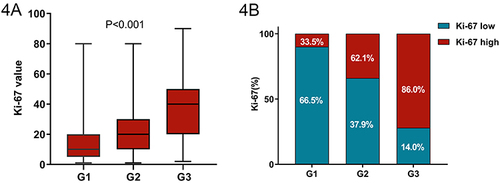
Table 3 Univariate Analysis of Prognosis with HR+/HER2- Breast Cancer
Table 4 Multivariate Analysis of Prognosis with HR+/HER2- Breast Cancer
Figure 5 Kaplan-Meier survival curve with the expression of Ki-67.
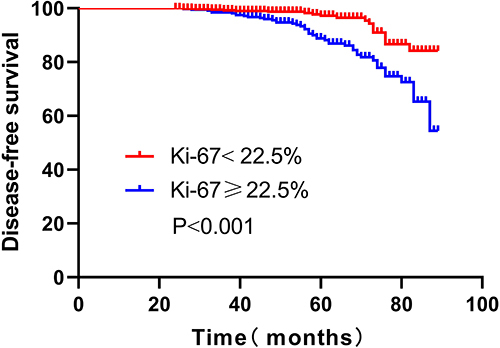
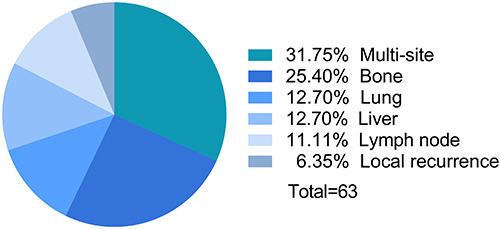
Figure 6 The common metastatic sites of HR+/HER2- breast cancer.