
Figures & data
Table 1 Baseline Characteristics of 195 Patients
Figure 1 Flow diagram of the analysis.
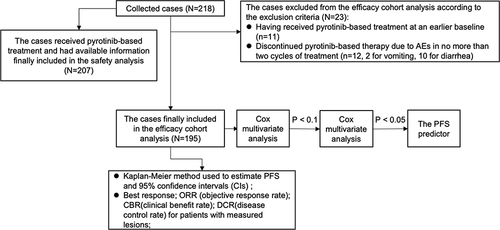
Table 2 Treatment Administration
Table 3 Efficacy for Total Population and Subgroups with Measured Lesions
Figure 2 Kaplan–Meier curves of progression-free survival (PFS) in total population (A) and lines of pyrotinib in metastatic setting (1 vs ≥2) (B).
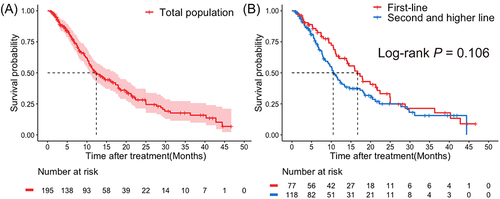
Table 4 The Predictor of PFS
Figure 3 Forest plot for survival outcomes of characterized patients in single-target pyrotinib subgroup and dual-targets pyrotinib plus trastuzumab subgroup.
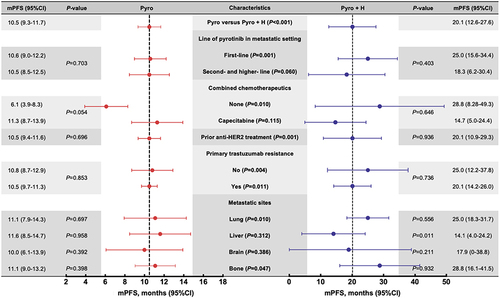
Figure 4 Kaplan–Meier curves of progression-free survival (PFS) of subgroup single-target: Pyro vs subgroup dual-targets: Pyro+H (A); subgroup dual-targets: Pyro+I and lines of Pyro+I in metastatic setting (1 vs ≥2) (B).
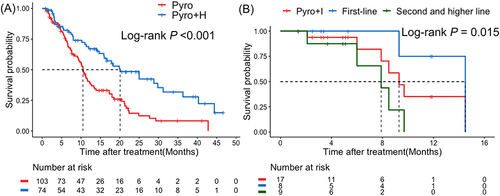
Figure 5 Kaplan–Meier curves of overall progression-free survival (PFS) in subgroup brain metastases (A); CNS-PFS in subgroup brain metastases (B); CNS-PFS of subgroup single-target: Pyro vs subgroup dual-targets: Pyro+H in subgroup brain metastases (C); CNS-PFS of subgroup chemotherapy combined vs no chemotherapy combined (D); CNS-PFS of subgroup capecitabine combined vs no chemotherapy combined (E); CNS-PFS of patients with or without local treatment in subgroup brain metastases (F).
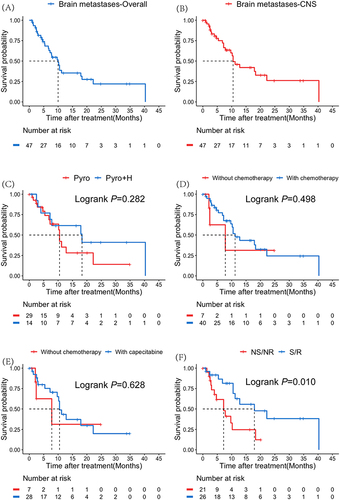
Table 5 Adverse Events (AEs) of 207 Patients
Data Sharing Statement
The data of this study could be obtained from the corresponding author upon reasonable request.