
Figures & data
Figure 1 The selection process of general information.
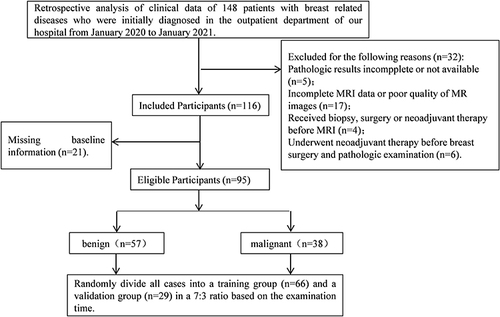
Figure 2 MRI images of the training and validation group.
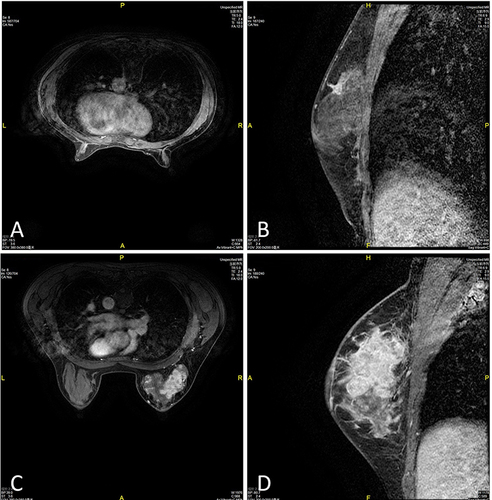
Table 1 Analysis of the Proportion of Disease Types (Cases, %)
Table 2 Comparison of General Information ()
Table 3 Comparative Analysis of MRI Examination Results and Pathological Results (Cases, %)
Table 4 Comparison of General Information Between Two Groups ()
Table 5 Radio-Omics Parameters Related to Lesions
Table 6 The Value of a Single MRI in the Diagnosis of Breast Cancer
Figure 3 ROC curve was used to analyze the diagnostic value of radiomics indicators of T1WI, T2WI, DWI, ADC and DCE in breast cancer.
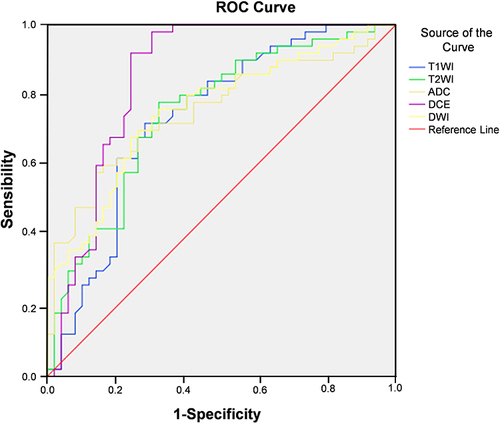
Table 7 Value of Combined MRI in Diagnosis of Breast Cancer
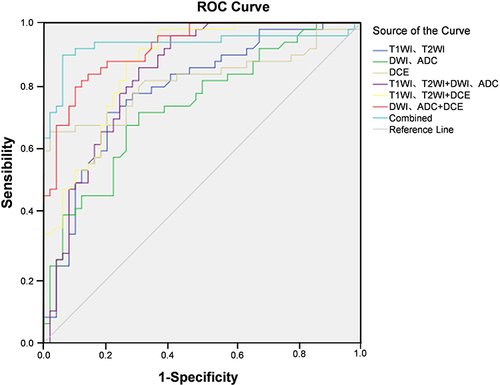
Figure 4 ROC curve was used to analyze the value of multimodal MRI in the diagnosis of breast cancer.
Data Sharing Statement
The datasets used and/or analyzed during the current study are available from the corresponding author on reasonable request.