
Figures & data
Table 1 Clinicopathologic Features of Patients Involved in This Study
Table 2 Relationships Between NAR and Patient Characteristics
Table 3 Relationships Between pCR and Patient Characteristics
Figure 1 Receiver operating characteristic curve for determination of the cut-off value for the NAR in patients with breast cancer with NAC.
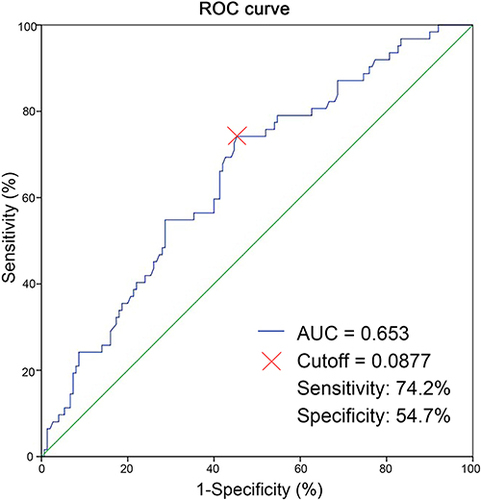
Figure 2 NAR values for non-pCR vs patients with pCR. Dashed lines represent the median, while dotted lines indicate the interquartile range.
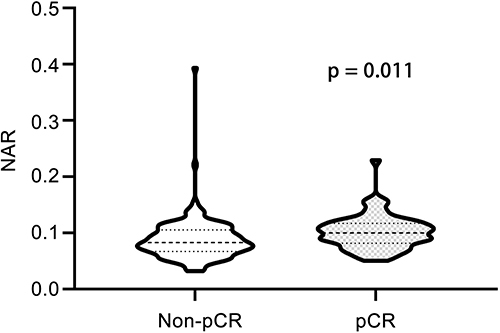
Table 4 Association of Patient/Tumor Characteristics to pCR in Univariate and Multivariate Analysis
Data Sharing Statement
The original contributions presented in the study are included in the article material, further inquiries can be directed to the corresponding author.