Figures & data
Figure 1 Schematic diagram showing the immobilization of herceptin on mercaptosuccinic acid-coated gold nanoparticles.
Abbreviations: EDA, ethylenediamine; GNP, gold nanoparticle; WSC, water-soluble carbodiimide.
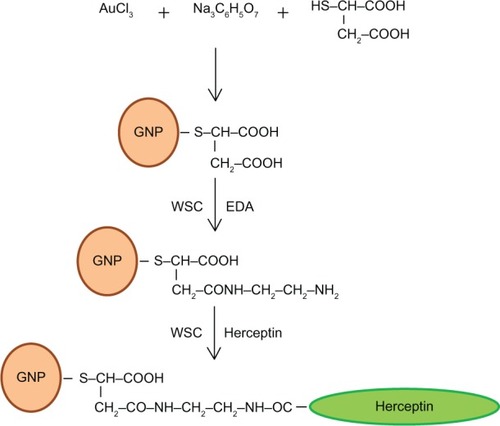
Figure 2 UV spectra of GNP and GNP–Her.
Abbreviations: GNP, gold nanoparticle; GNP–Her, herceptin-conjugated GNP; UV, ultraviolet.
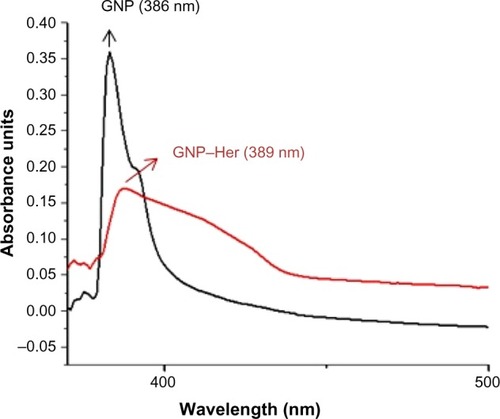
Figure 3 FT-IR spectra of GNP (A) and GNP–Her (B) measured using the KBr method.
Abbreviations: FT-IR, Fourier transform infrared; GNP, gold nanoparticle; GNP–Her, herceptin-conjugated GNP; KBr, potassium bromide.
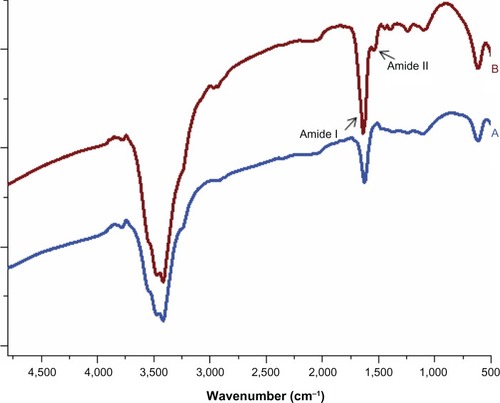
Figure 4 TEM images of GNP (A) and GNP–Her (B).
Abbreviations: TEM, transmission electron microscopy; GNP, gold nanoparticle; GNP–Her, herceptin-conjugated GNP.
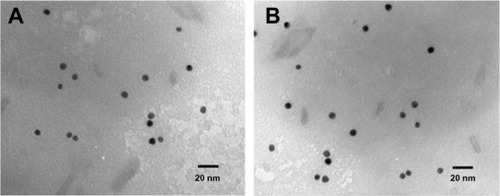
Figure 5 Particle-size distributions of GNP (A) and GNP–Her (B) measured by DLS.
Abbreviations: DLS, dynamic light scattering; GNP, gold nanoparticle; GNP–Her, herceptin-conjugated GNP.
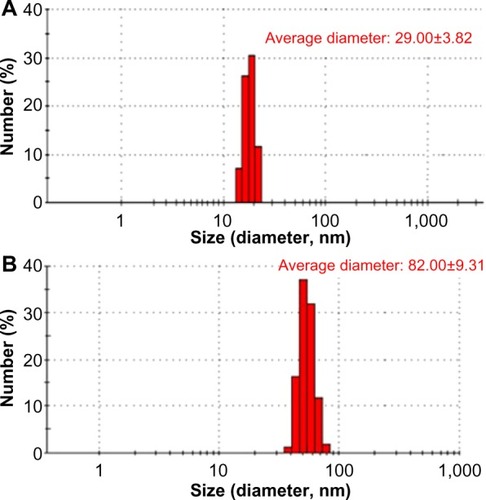
Figure 6 UV–vis absorption spectra of the GNP–Her-conjugated Cy5 dye (A), Cy5 dye (B), and GNP (C) in aqueous solution.
Abbreviations: GNP, gold nanoparticle; GNP–Her, herceptin-conjugated GNP; UV–vis, ultraviolet–visible.
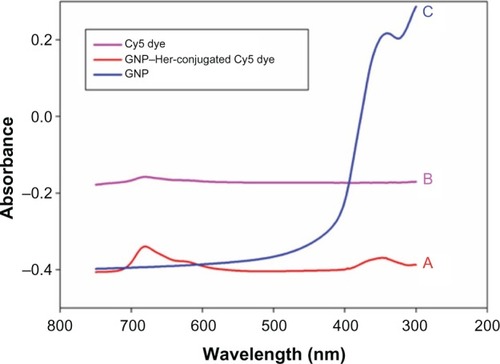
Figure 7 Fluorescence microscopy.
Notes: Fluorescence microscopy images of live and dead FB (A) and SK-BR3 (B) cells after culturing for 3 days in a polystyrene culture dish in the presence of culture medium and GNP–Her. The live and dead cells were stained and visualized in green and red, respectively, under a fluorescence microscope.
Abbreviations: GNP, gold nanoparticle; GNP–Her, herceptin-conjugated GNP; FB, fibroblast cell line.
Abbreviations: GNP, gold nanoparticle; GNP–Her, herceptin-conjugated GNP; FB, fibroblast cell line.
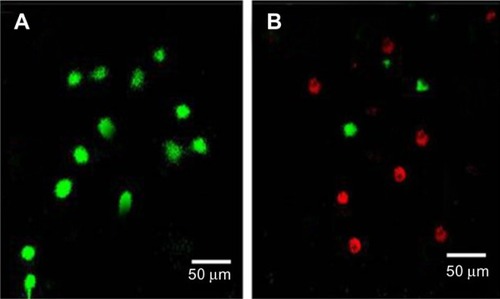
Figure 8 MTT assay.
Notes: Absorbance as a measure of the cell proliferation of SK-BR3 cells cultured in the polystyrene culture dish (the blue bar), in the presence of GNP (the red bar), and with GNP–Her (the green bar) for different time periods.
Abbreviations: GNP, gold nanoparticle; GNP–Her, herceptin-conjugated GNP; MTT, 3-(4,5-dimethylthiazol-2-yl)-2,5-diphenyltetrazolium bromide.
Abbreviations: GNP, gold nanoparticle; GNP–Her, herceptin-conjugated GNP; MTT, 3-(4,5-dimethylthiazol-2-yl)-2,5-diphenyltetrazolium bromide.
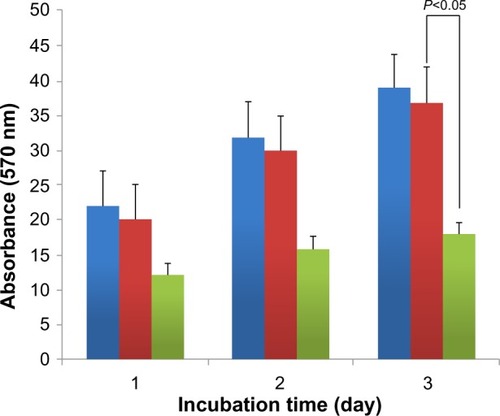
Figure 9 Amount of GNP (black bar) and GNP–Her (gray bar) taken up by SK-BR3 cells at different incubation times, as determined by ICP–MS.
Abbreviations: GNP, gold nanoparticle; GNP–Her, herceptin-conjugated GNP; ICP–MS, inductively coupled plasma mass spectrometry.
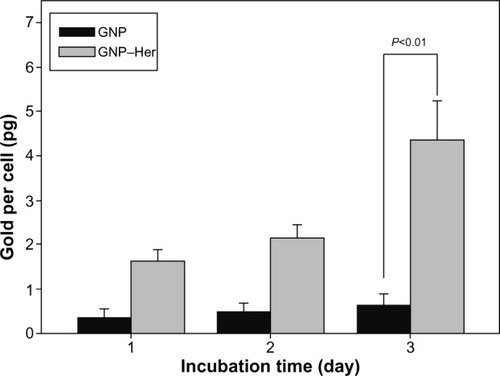
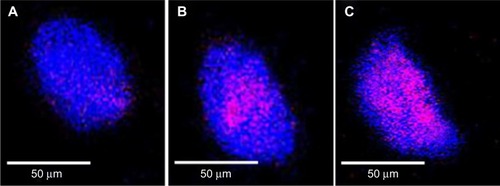
Figure 10 Fluorescence images of SK-BR3 cells.
Notes: Images were obtained from the culture of SK-BR3 cells for 1 hour (A), 3 hours (B), and 6 hours (C) in the presence of DAPI, and these show specific HER2 interaction with herceptin.
Abbreviations: HER2, human epidermal growth factor receptor 2; DAPI, 4,6-diamidino-2-phenylindole dihydrochloride.
Abbreviations: HER2, human epidermal growth factor receptor 2; DAPI, 4,6-diamidino-2-phenylindole dihydrochloride.