
Figures & data
Figure 1 Kaplan–Meier survival curve of the LTZ and the A-LTZ groups of patients (all stages).
Abbreviations: A-LTZ, anastrozole followed by letrozole; LTZ, letrozole.
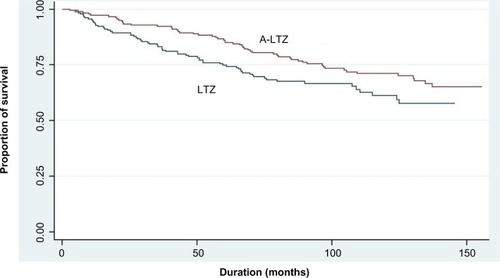
Figure 2 Kaplan–Meier survival curve of stage 4 LTZ and A-LTZ patients.
Abbreviations: A-LTZ, anastrozole followed by letrozole; LTZ, letrozole.
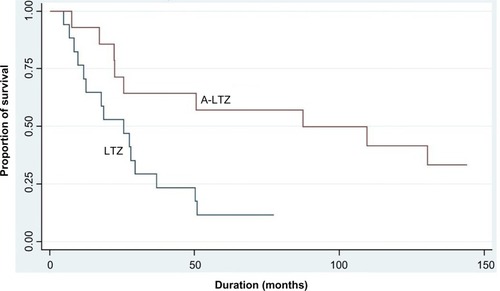
Table 1 Comparison of demographic data between the LTZ and the A-LTZ groups of patients
Table 2 Survival analysis between the LTZ and the A-LTZ groups of patients