Figures & data
Figure 1 EGF induces sialidase activity in live (A) TNBC MDA-MB-231 cells, (B) MDA-MB-231 cells and its resistant clones against 5 μM and 10 μM tamoxifen, and (C) MCF-7 cells and its resistant clones against 5 μM and 10 μM tamoxifen.
Abbreviations: EGF, epidermal growth factor; FCS, fetal calf serum; MMP-9, matrix metalloproteinase-9; OP, oseltamivir phosphate; TNBC, triple-negative breast cancer.
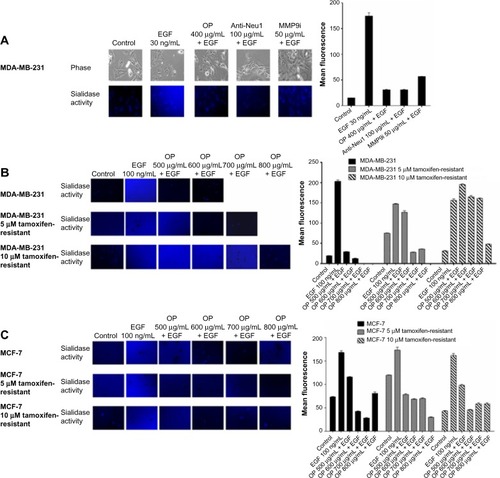
Figure 2 Cell viability of (A) MCF-7 and (C) MDA-MB-231 cells treated with tamoxifen at indicated doses, (B) MCF-7 and (D) MDA-MB-231 cells and their resistant clones against 5 μM and 10 μM tamoxifen treated with OP at indicated doses using the WST-1 assay.
Abbreviations: DMEM, Dulbecco’s Modified Eagle’s Medium; FCS, fetal calf serum; IC50, half maximal inhibitory concentration; LD50, lethal dose to kill 50% of viable cells; OP, oseltamivir phosphate; SEM, standard error of the mean.
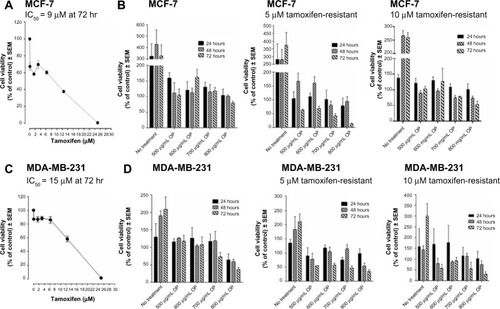
Figure 3 Cell viability of MDA-MB-231 cells treated with OP at indicated doses in combination with 1 μM of either cisplatin, 5-FU, paclitaxel, gemcitabine, or tamoxifen using the WST-1 assay.
Abbreviations: 5-FU, 5-fluorouracil; DMEM, Dulbecco’s Modified Eagle’s Medium; FCS, fetal calf serum; OP, oseltamivir phosphate; SEM, standard error of the mean.
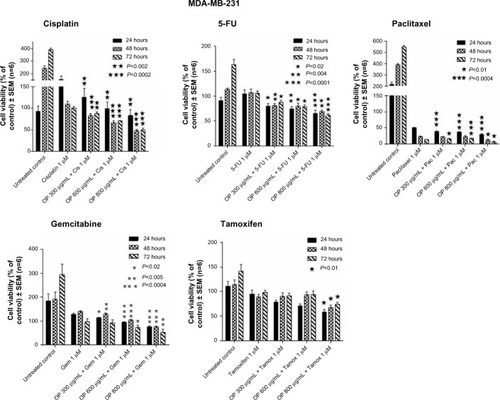
Figure 4 OP treatment of RAGxCγ double mutant mice bearing heterotopic xenograft of MDA-MB-231 tumors.
Abbreviations: BSA, bovine serum albumin; H&E, hematoxylin and eosin; ip, intraperitoneally; ns, not significant; OP, oseltamivir phosphate; PBS, phosphate-buffered saline; SEM, standard error of the mean.
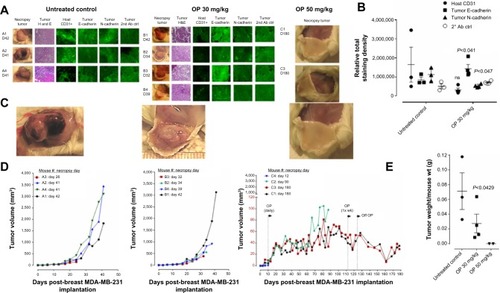
Figure 5 (A) Percent survival of indicated cohorts of mice taken from and (B) mean ± SEM of live necropsy spleen, pancreas, heart, and liver weight per mouse body weight for each of the cohorts in .
Abbreviations: OP, oseltamivir phosphate; SEM, standard error of the mean.
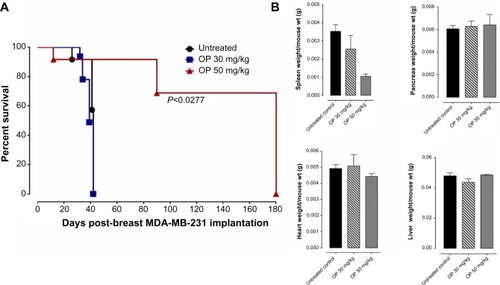
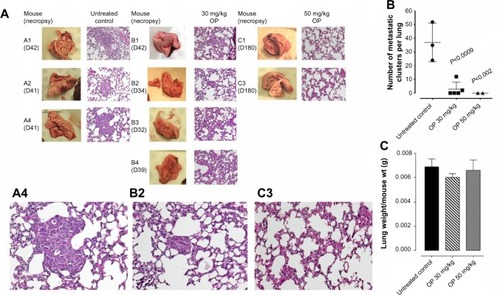
Figure 6 (A) H&E staining of necropsy lung for number of metastatic clusters per lung (B) in paraffin-embedded tissues taken from xenograft A2780 tumor-bearing RAGxCγ double mutant mice.
Abbreviations: H&E, hematoxylin and eosin; ip, intraperitoneally; OP, oseltamivir phosphate; SEM, standard error of the mean; TNBC, triple-negative breast cancer.