Figures & data
Figure 1 Effect of 2-DG, metformin, and their combination with Cobalt60 radiation on MCF-7 cells.
Abbreviations: 2-DG, 2-deoxy-d-glucose; ATP, adenosine triphosphate; Gy, grey; Met F, metformin; SEM, standard error of mean.
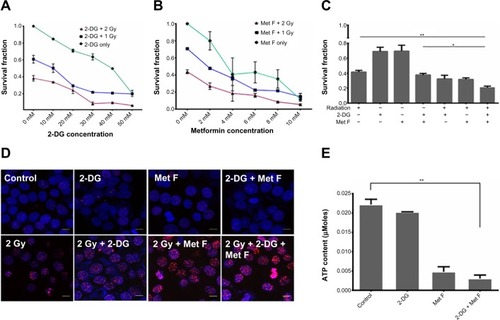
Figure 2 Cell cycle status at different time points of treatment of MCF-7 cell.
Abbreviations: 2-DG, 2-deoxy-d-glucose; Gy, grey; Met F, metformin.
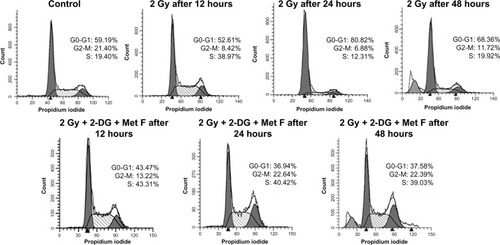
Figure 3 Characterization of MCF-7 cells stably expressing NIS.
Abbreviations: AttB, attachment site of bacteria; CAG, synthetic promoter made by fusion of various elements; Cyto, cytoplasmic; DAPI, 4′,6-diamidino-2-phenylindole; NIS, sodium-iodide symporter; SEM, standard error of mean.
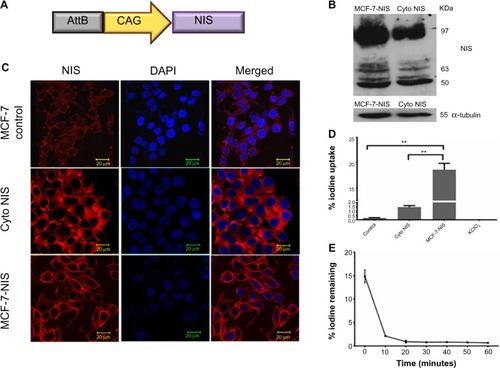
Figure 4 Cytotoxic effect of radioiodine therapy in MCF-7 cells stably expressing NIS.
Abbreviations: NIS, sodium-iodide symporter; SEM, standard error of mean.
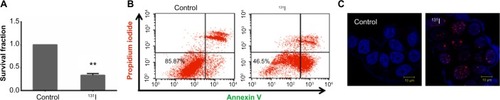
Figure 5 Effect of 2-DG, metformin, and their combination with 131I treatment on different prospects of MCF-7 NIS cells.
Abbreviations: 2-DG, 2-deoxy-d-glucose; Met F, metformin; NIS, sodium-iodide symporter; ns, not significant.
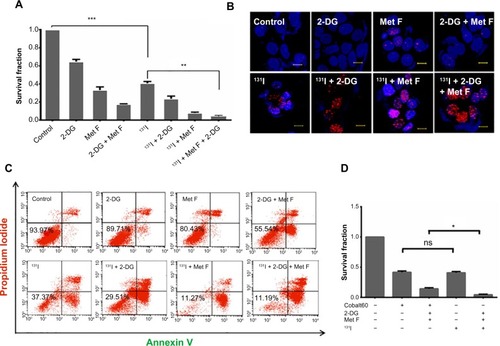
Figure 6 Effect of 2-DG, metformin, and their combination with 131I treatment on survival of plain MCF-7 cells.
Abbreviations: 2-DG, 2-deoxy-d-glucose; Met F, metformin; NIS, sodium-iodide symporter; PI, propidium iodide.
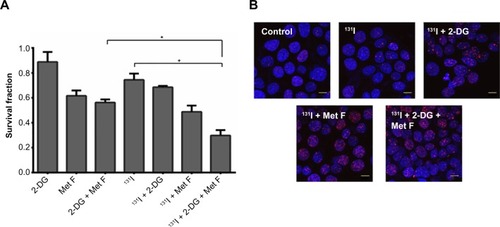
Figure S1 Cytotoxic effect of 2-DG and metformin in (A) MCF-7 and (B) MDA MB 231 breast cancer cell lines.
Abbreviations: 2-DG, 2-deoxy-d-glucose; Met F, metformin.
Figure S2 Effect of 2-DG, metformin, and their combination with Cobalt60 radiation on MDA MB 231 cells.
Abbreviations: 2-DG, 2-deoxy-d-glucose; Ctrl, control; Gy, grey; Met F, metformin; ns, not significant.
Figure S3 Effect of Cobalt60 radiation and it’s combination with 2-DG and Met F on foci formation in MCF-7 cells.
Abbreviations: 2-DG, 2-Deoxy-d-glucose; DAPI, 4′,6-diamidino-2-phenylindole; Gy, grey; IF, immunofluorescence; Met F, metformin; MFI, mean fluorescence intensity.
Figure S4 (A) Foci assay images from (MCF-7 NIS cells treated with 131I and its combination with radio sensitizers) showing foci staining with dylight 633 secondary antibody in red channel, nucleus stained with DAPI in blue channel, and merged image showing colocalization of foci with nucleus. Scale bars represent 10 μm. (B) Quantification of foci from the IF images. In each sample, 50 cells were quantified for intensity of staining from various fields of the cover slip.
Figure S5 (A) Foci assay images from (MCF-7 plain cells treated with 131I and its combination with radio sensitizers) showing foci staining with dylight 633 secondary antibody in red channel, nucleus stained with DAPI in blue channel, and merged image showing colocalization of foci with nucleus. Scale bars represent 10 μm. (B) Quantification of foci from the IF images. In each sample, 50 cells were quantified for intensity of staining from various fields of the cover slip.