Figures & data
Table 1 Primer pairs used in qPCR analysis
Figure 1 Microarray clustering analysis.
Notes: The color represents the expression level of the gene. Red represents high expression, while green represents low expression. The expression levels are continuously mapped on the color scale provided at the right of the figure. On the left the experiments are presented as heat maps with the name of samples on the top, and the names of probes on the right.
Abbreviations: ESCs, embryonic stem cells; CSCs, cancer stem cells.
Abbreviations: ESCs, embryonic stem cells; CSCs, cancer stem cells.
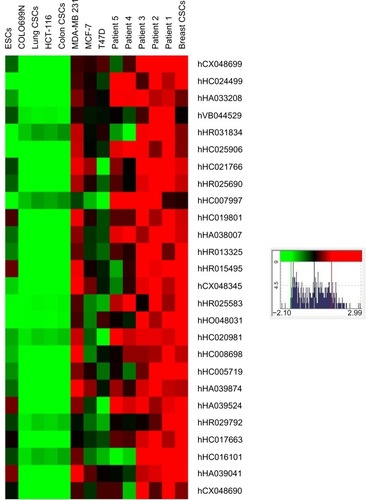
Figure 2 Gene expression among different cancer types.
Notes: Relative gene expression analysis of nine genes that were overexpressed in breast cancer and breast CSCs. The gene expression also was studied in colon and lung cancer, colon CSCs, lung CSCs, embryonic stem cells, and in a reference sample. The experiments were performed in triplicate and a P-value of <0.05 was considered significant.
Abbreviations: CSCs, cancer stem cells; ESCs, embryonic stem cells; HP, haptoglobin; SMPD1, sphingomyelin phosphodiesterase 1, acid lysosomal; SCRIB, scribbled homolog (Drosophila); KCMF1, potassium channel modulatory factor 1; FAM155B, family with sequence similarity 155, member B; PTGER3, prostaglandin E receptor 3 (subtype EP3); GPR3, G protein-coupled receptor 3; TMX2, thioredoxin-related transmembrane protein 2; DDX49, DEAD (Asp-Glu-Ala-Asp) box polypeptide 49.
Abbreviations: CSCs, cancer stem cells; ESCs, embryonic stem cells; HP, haptoglobin; SMPD1, sphingomyelin phosphodiesterase 1, acid lysosomal; SCRIB, scribbled homolog (Drosophila); KCMF1, potassium channel modulatory factor 1; FAM155B, family with sequence similarity 155, member B; PTGER3, prostaglandin E receptor 3 (subtype EP3); GPR3, G protein-coupled receptor 3; TMX2, thioredoxin-related transmembrane protein 2; DDX49, DEAD (Asp-Glu-Ala-Asp) box polypeptide 49.
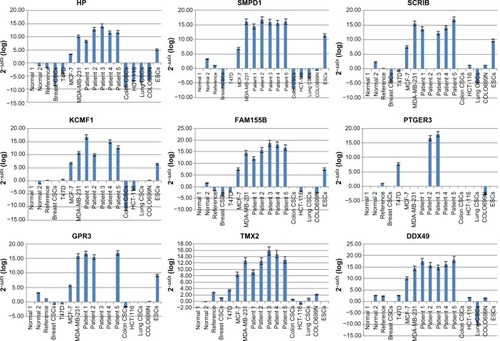
Figure 3 Breast CSCs pre- and post-siRNA knockdown.
Note: Representative images showing breast CSCs pre- and post-siRNA knockdown.
Abbreviations: CSCs, cancer stem cells; siRNA, small interfering RNA; TMX2, thioredoxin-related transmembrane protein 2; FAM155B, family with sequence similarity 155, member B; PTGER3, prostaglandin E receptor 3 (subtype EP3); GPR3, G protein-coupled receptor 3; DDX49, DEAD (Asp-Glu-Ala-Asp) box polypeptide 49.
Abbreviations: CSCs, cancer stem cells; siRNA, small interfering RNA; TMX2, thioredoxin-related transmembrane protein 2; FAM155B, family with sequence similarity 155, member B; PTGER3, prostaglandin E receptor 3 (subtype EP3); GPR3, G protein-coupled receptor 3; DDX49, DEAD (Asp-Glu-Ala-Asp) box polypeptide 49.
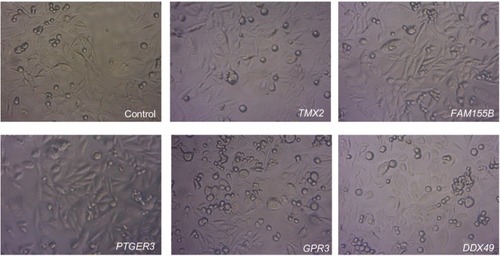
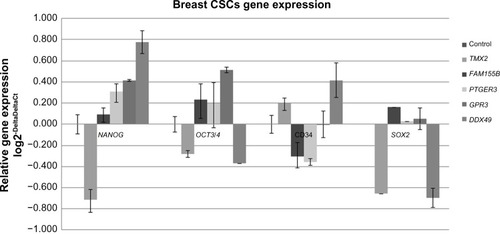
Figure 4 Gene expression of stemness transcription factors in breast CSCs.
Notes: Relative gene expression of transcription factors in breast CSCs following knockdown. The ∆∆Ct method was used to perform the analysis. Each bar represents the average of the Ct values. The assays were performed in triplicate and a P-value of <0.05 was considered to be significant. The assays are presented in a log2 scale. Thus, positive values indicate overexpression while negative values indicate underexpression.
Abbreviations: CSCs, cancer stem cells; TMX2, thioredoxin-related transmembrane protein 2; FAM155B, family with sequence similarity 155, member B; PTGER3, prostaglandin E receptor 3 (subtype EP3); GPR3, G protein-coupled receptor 3; DDX49, DEAD (Asp-Glu-Ala-Asp) box polypeptide 49; NANOG, Homeobox protein NANOG; OCT3/4, Octamer-binding transcription factor ¾; SOX2, sex determining region Y-box 2; CD34, Hematopoietic progenitor cell antigen CD34.
Abbreviations: CSCs, cancer stem cells; TMX2, thioredoxin-related transmembrane protein 2; FAM155B, family with sequence similarity 155, member B; PTGER3, prostaglandin E receptor 3 (subtype EP3); GPR3, G protein-coupled receptor 3; DDX49, DEAD (Asp-Glu-Ala-Asp) box polypeptide 49; NANOG, Homeobox protein NANOG; OCT3/4, Octamer-binding transcription factor ¾; SOX2, sex determining region Y-box 2; CD34, Hematopoietic progenitor cell antigen CD34.