Figures & data
Table 1 Hyperspectral immunologic panels
Figure 1 Comparison of expression heterogeneity using the distribution variance with patient tumor size for the markers: ALDH1, uPAR, and Her-2.
Notes: Marker variance, as a measure for heterogeneity, compared to tumor size. Least squares fit line to the data points also plotted. Heterogeneity in marker overexpression increases with tumor size in BC patients while heterogeneity in TN patients decreases with tumor size.
Abbreviations: ALDH1, acetaldehyde dehydrogenases 1; uPAR, urokinase plasminogen activator surface receptor; Her-2, human epidermal growth factor receptor 2; BC, breast cancer; TN, triple-negative; LSfit, least squares fit; Cts/s/pxl, counts/second/pixel.
Abbreviations: ALDH1, acetaldehyde dehydrogenases 1; uPAR, urokinase plasminogen activator surface receptor; Her-2, human epidermal growth factor receptor 2; BC, breast cancer; TN, triple-negative; LSfit, least squares fit; Cts/s/pxl, counts/second/pixel.
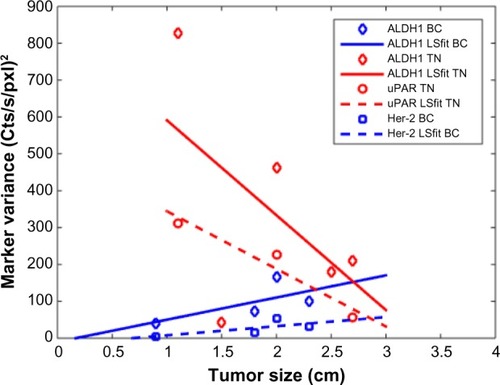
Table 2 Fraction of overexpressed cells for each marker
Figure 2 Cell marker expression of ALDH1, uPAR, CD133, and Her-2.
Notes: All cells plotted for: (A) ALDH1, (B) uPAR, (C) CD133, and (D) Her-2. Measurements are plotted in the order the cells were scanned. Solid horizontal lines indicate the emission threshold for overexpressed. Dashed-dotted horizontal lines indicate twice as bright as the threshold expression. *The “n” indicates that the examined cells demonstrate no stem cell markers.
Abbreviations: ALDH1, acetaldehyde dehydrogenases 1; uPAR, urokinase plasminogen activator surface receptor; CD133, cluster of differentiation 133; Her-2, human epidermal growth factor receptor 2; CSC, cancer stem cells; Cts/s/pxl, counts/second/pixel; BC, breast cancer; TN, triple-negative.
Abbreviations: ALDH1, acetaldehyde dehydrogenases 1; uPAR, urokinase plasminogen activator surface receptor; CD133, cluster of differentiation 133; Her-2, human epidermal growth factor receptor 2; CSC, cancer stem cells; Cts/s/pxl, counts/second/pixel; BC, breast cancer; TN, triple-negative.
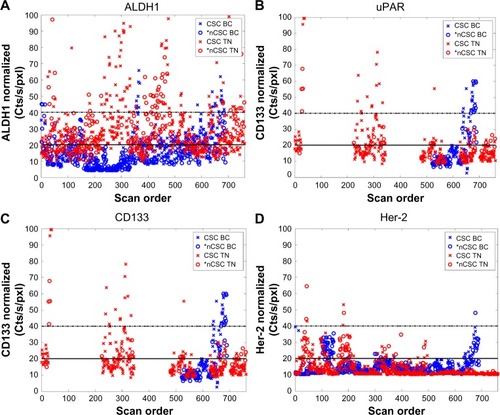
Figure 3 CD44 versus CD24 expression for all cells for both hormonal receptor positive and TNBC patients.
Notes: Solid horizontal and vertical lines indicate the emission threshold for overexpressed. Dashed-dotted horizontal and vertical lines indicate twice as bright as threshold overexpressed. Diagonal solid line indicates the cells which have higher expression in one antibody over the other (ie, all CD44+/CD24− are above the line). The TN cell, plotted in red, shows a larger heterogeneity than the BC cells, plotted in blue. *The “n” indicates that the examined cells demonstrate no stem cell markers.
Abbreviations: BC, breast cancer; TN, triple-negative; CSC, cancer stem cells; CD, cluster of differentiation; Cts/s/pxl, counts/second/pixel.
Abbreviations: BC, breast cancer; TN, triple-negative; CSC, cancer stem cells; CD, cluster of differentiation; Cts/s/pxl, counts/second/pixel.
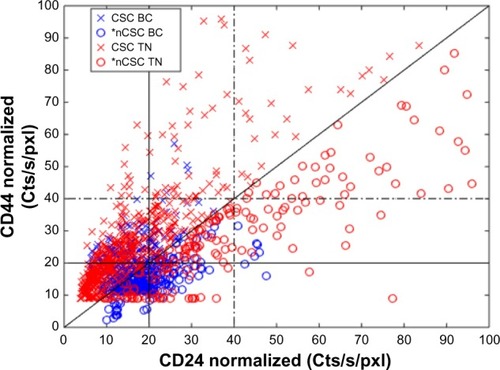
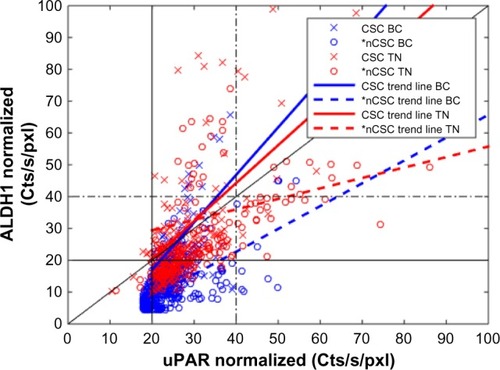
Figure 4 Comparison of cell expression of ALDH1 versus uPAR.
Notes: ALDH1 expression compared to uPAR expression for each cell. Plot symbols group data by BC and TN patients and subgroup by CSC and non-CSC. Trend lines of the data subgroups indicate higher heterogeneity in BC and TN patient cells, which have the stem cell CD44+/CD24− character. *The “n” indicates that the examined cells demonstrate no stem cell markers.
Abbreviations: ALDH1, acetaldehyde dehydrogenases 1; uPAR, urokinase plasminogen activator surface receptor; BC, breast cancer; TN, triple-negative; CSC, cancer stem cells; CD, cluster of differentiation; Cts/s/pxl, counts/second/pixel.
Abbreviations: ALDH1, acetaldehyde dehydrogenases 1; uPAR, urokinase plasminogen activator surface receptor; BC, breast cancer; TN, triple-negative; CSC, cancer stem cells; CD, cluster of differentiation; Cts/s/pxl, counts/second/pixel.