
Figures & data
Figure 1 Conceptual model of using variability in genes evaluated as part of prognostic multigene expression profiles for breast cancer to test the hypothesis that heterogeneity in the biology of breast cancers at the cellular level could account for symptom variation.
Note: Dashed arrows represent relationships to be tested in future investigations.
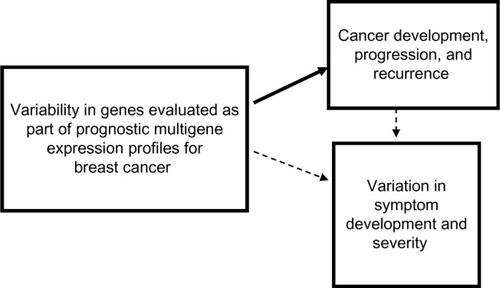
Table 1 Prognostic multigene expression profiles
Figure 2 Overlapping canonical pathways map representing shared biology among the identified candidate genes.
Notes: Connected canonical pathways share one or more genes in common. The brighter the red of the node, the more significant the canonical pathway in the gene set. The canonical pathways map was generated through the use of QIAGEN’s Ingenuity Pathway Analysis (IPA®, QIAGEN Redwood City, www.qiagen.com/ingenuity).
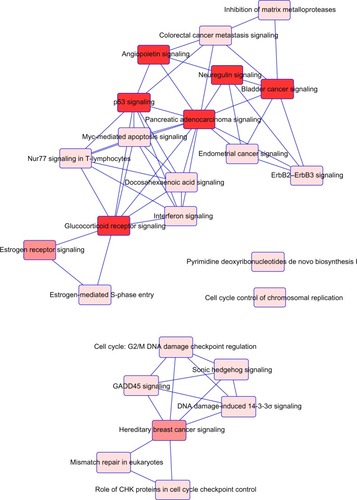
Figure 3 Gene–gene networks generated by pathway analysis.
Notes: The networks were generated through the use of QIAGEN’s Ingenuity Pathway Analysis (IPA®, QIAGEN Redwood City, www.qiagen.com/ingenuity). Identified candidate genes are highlighted in green. All identified candidate genes are included. The main associated functions of each network are as follows: (A) cancer, organismal injury and abnormalities, and reproductive system disease; (B) DNA replication, recombination, and repair, connective tissue disorders, and dental disease; and (C) cellular development, reproductive system development and function, and molecular transport. The node shapes and relationship type legend can be found at http://ingenuity.force.com/ipa/articles/Feature_Description/Legend.
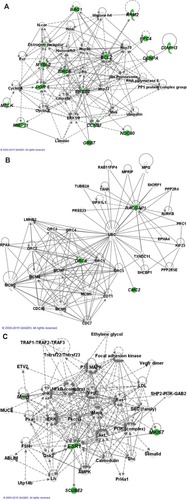
Table 2 Genes utilized in two or more prognostic multigene expression profiles as indicated by X