Figures & data
Figure 1 Characterization of bystander cell line.
Notes: (A) Flow cytometry bead analysis of GM-CSF secretion levels by the bystander cells and the standards used for quantification. The rightmost peak is the bystander cells and the peak immediately to the left of it is the 2,500 pg/mL standard. (B) Flow cytometry for surface expression of CD40L showing distinct population of positive cells with negative controls (stained and unstained parental B78H1 cells plus unstained BCG cells). Data are representative of duplicate experiments for each analyte.
Abbreviations: GM-CSF, granulocyte-macrophage colony stimulating factor; CD40L, CD40 ligand.
Abbreviations: GM-CSF, granulocyte-macrophage colony stimulating factor; CD40L, CD40 ligand.
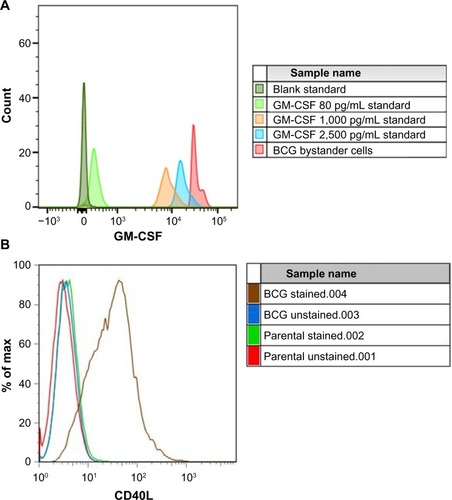
Figure 2 Tumor growth curves for 4T1 alone and 4T1 + BCG vaccinated groups. These results are representative of duplicate experiments. The bars display standard error.
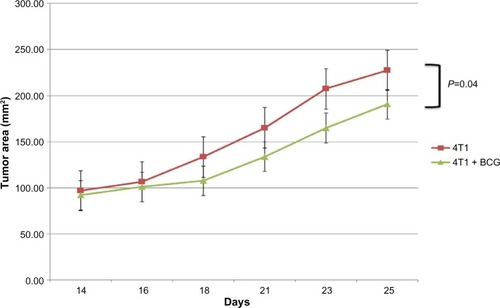
Figure 3 Tumor growth curves for LLC alone and LLC + BCG vaccinated groups. These results are representative of duplicate experiments. The bars display standard error.
Abbreviation: LLC, Lewis lung carcinoma; Tm, tumor.
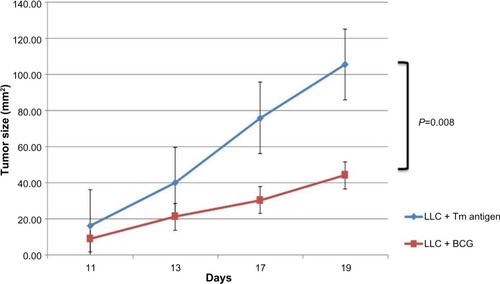
Figure 4 Immune response analysis.
Notes: (A) Average ELISPOT counts for interferon-γ (IFN-γ) and interleukin-2 (IL-2) between the 4T1 alone (4T1) and 4T1 + BCG (BCG) harvested lymphocytes cocultured with 4T1 lysates (top). The ELISPOT images above each bar are representative of the spot counts for each of the four groups. (B) The IFN-γ average ELISPOT counts are shown in the LLC tumor antigen alone versus the BCG vaccinated LLC mice. All experiments were done in triplicate. Spot counts in the treatment groups were adjusted for background using the no-tumor mouse lymphocytes. Error bars are the SD’s for the groups. *P-value statistically significant.
Abbreviations: ELISPOT, enzyme-linked immunospot; LLC, Lewis lung carcinoma; SD, standard deviation.
Abbreviations: ELISPOT, enzyme-linked immunospot; LLC, Lewis lung carcinoma; SD, standard deviation.
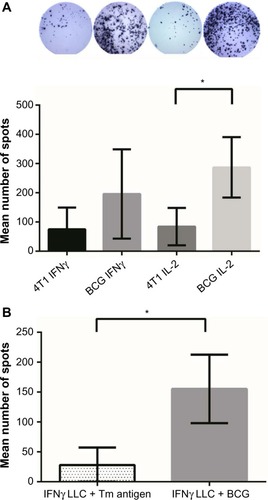
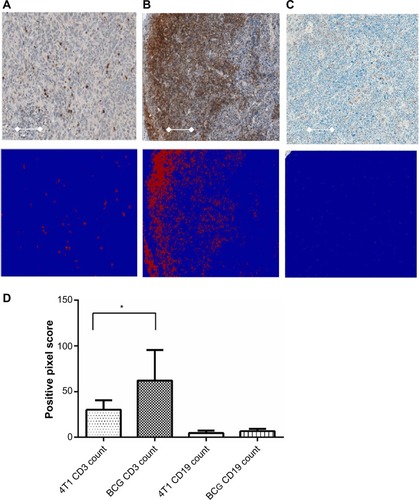
Figure 5 Immunohistochemical analysis of tumor infiltrating lymphocytes using an automated image analysis algorithm.
Notes: (A) Representative slide image showing CD3 staining in 4T1 group with the red (CD3)/blue (viable tumor) image beneath demonstrating the positive pixel algorithm image annotation used for scoring. (B) Representative slide image and positive pixel algorithm image for the BCG group demonstrating significantly more CD3 positivity in the analyzed sections. The white bar on each slide image is 100 µM to show scale. (C) The same CD3+ region shown in B stained for CD19 shows very low level of B-cell infiltrates with a similar low detection in the algorithm image (D). Average CD3+ and CD19+ pixel count scores for the 4T1 and BCG tumor sections evaluated using the positive pixel count algorithm. Error bars are SD of the groups. *P= <0.05.
Abbreviation: SD, standard deviation.
Abbreviation: SD, standard deviation.