Figures & data
Figure 1 (A) Illustration of the sgRNA sequences-directed CRISPR/Cas9 system and their corresponding regions in BIRC5 gene as well as the vectors used in this study. PAM sequences are labeled in yellow; sgRNAs in red, as well as sense and anti-sense strands of the BIRC5 gene are shown in navy blue and dark green, respectively. (B) SV40 Poly A, simian vacuolating virus 40 polyadenylation signal sequence; CITE, EMC virus Cap-Independent Translation Enhancer sequence; CMV, cytomegalovirus promoter; U6 promoter, U6 small nuclear RNA promoter, which drives transcription by RNA polymerase III; neo, Neomycin; Hygro, Hygromycin; pUC ori, origin of replication that “UC” stands for the “University of California”. (C) Assessment of transfection efficiency using mCherry visualization. HL60 and KG1 cell lines were cotransfected with Lipofectamine 3000 and visualized under phase contrast or fluorescence microscopy 2 days post-transfection. Untransfected (E), Transfected cells visualized under phase-contrast microscopy (F), and transfected cells visualized under fluorescence microscopy (G) 2 days post-transfection.
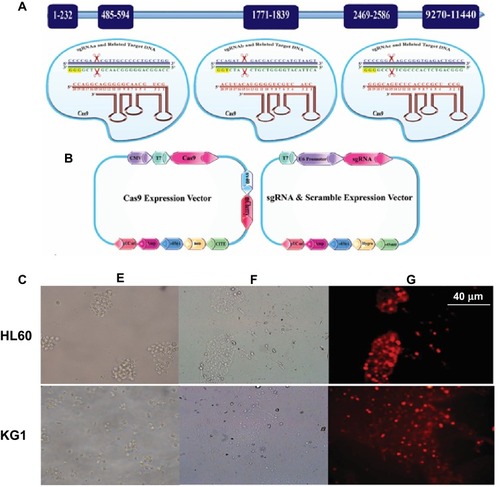
Figure 2 CRISPR/Cas9 -mediated cleavage at BIRC5 locus in AML cells. (Left) PCR detection and (Right) Surveyor assay of CRISPR/Cas9 activity in HL60 and KG1 cell lines. The numbers on the left represent the sizes of the DNA Ladder. The numbers at the bottom of the gel indicate mutation percentages measured by band intensities.
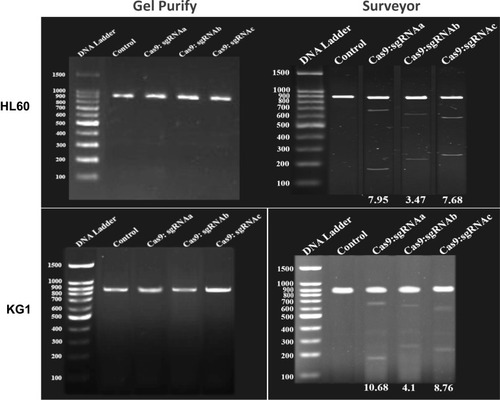
Figure 3 BIRC5 expression was quantitatively evaluated via RT-qPCR 48 h after cotransfection using sgRNAa, sgRNAb, sgRNAc and Cas9 vectors. Relative expression values were normalized assigning the value of the cells in control groups to 1.0. Error bars represent mean ± s.d. of biological replicates from one experiment (P<0.0001).
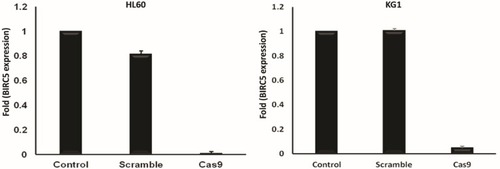
Figure 4 Proliferation of the various groups–cotransfected HL60 and KG1 cells via sgRNAa, sgRNAb, sgRNAc and Cas9 vectors was quantified using an MTT assay 48 hrs after transfection. The viability of the untreated cells was considered as 100%, and the viability of other groups is presented as the percentage of the untreated cells. Data were mean ± s.d. of three independent experiments (P<0.0001).
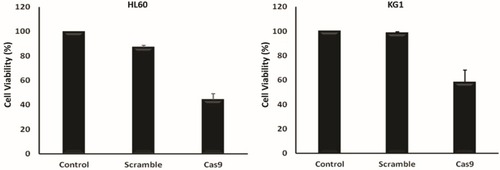
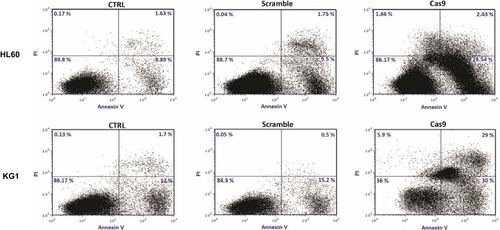
Figure 5 Targeting of survivin resulted in the induction of apoptosis in leukemic cell lines. 48 hrs after cotransfection of sgRNAa, sgRNAb, sgRNAc cells were stained with Annexin V and PI. The cells were subjected to flow cytometry analysis right away. Representative analysis of at least three flow cytometry analysis was shown.