
Figures & data
Figure 1 Consensus cluster analysis of genes related to cuproptosis. (A) Consensus clustering heatmap of genes associated with cuproptosis with k = 2. (B) Kaplan-Meier survival curve between cluster 1 and cluster 2. (C) The volcanic map showed the differential genes of the two clusters. (D) Heatmap of differential genes.
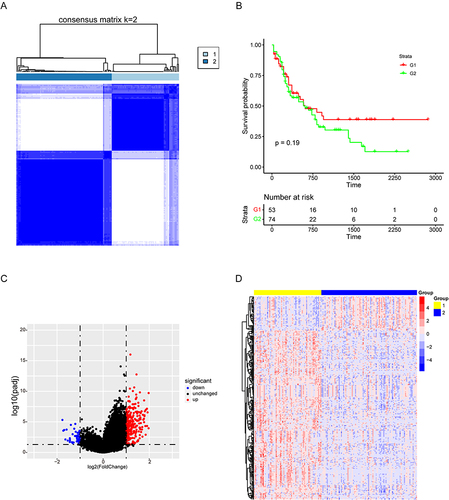
Figure 2 Screening of LncRNAs and miRNAs associated with AML tumor progression. (A–B) Forest maps showed the prognostic value of lncRNAs and miRNAs based on univariate cox proportional hazard regression analysis (P < 0.05).
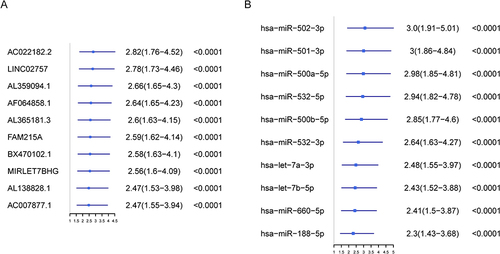
Figure 3 AC024896.1/miR−363−3p/MYO1B may be an important ceRNA axis in the regulation of AML. (A) Sankey diagram for the ceRNA network in ALL. Each rectangle represents a gene, and the connection degree of each gene is visualized based on the size of the rectangle. (B) The ceRNA regulatory network.
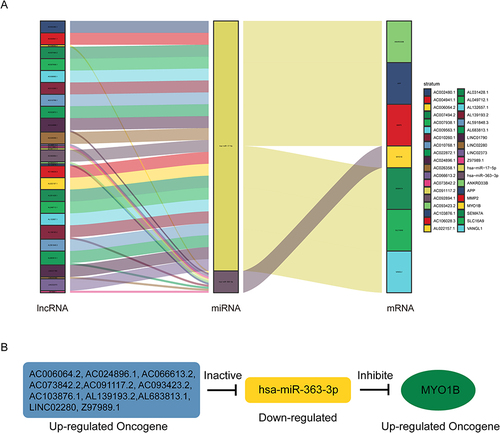
Figure 4 AC024896.1 may regulate the nucleic acid and protein levels of MYO1B. (A) Survival analysis in the high and low expression lncRNAs groups. (B) Correlation analysis between these lncRNAs and MYO1B. (C) The expression level of MYO1B after knockdown of these lncRNAs using ASO was examined by qPCR. (**P < 0.01, and ***P < 0.001, ****P < 0.0001).
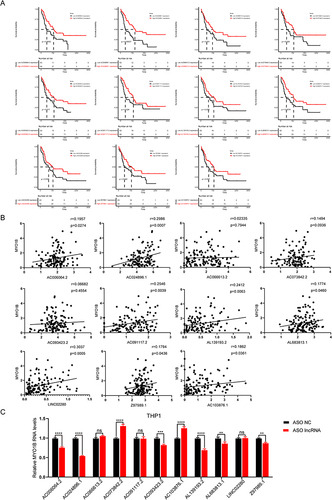
Figure 5 AC024896.1, miR-363-3p and MYO1B regulate the malignant progression of AML. (A) GSEA enrichment map. (B–C) CCK-8 assay showed that AC024896.1, miR-363-3p or MYO1B knockdown inhibited THP1 and Kasumi cells activity. (***P < 0.001, ****P < 0.0001).
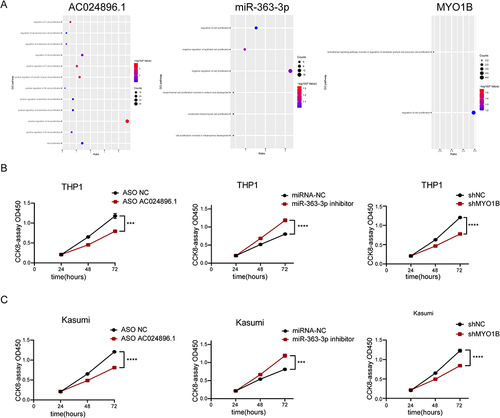
Figure 6 LncRNA AC024896.1 and miR-363-3p could regulate MYO1B protein in AML. (A) Correlation analysis of AC024896.1, miR-363-3p, and MYO1B. (B) RT-qPCR was used to detect the expression levels of AC024896.1, MYO1B and miR-363-3p after knocking down AC024896.1 with ASO or adding miR-363-3p mimic or inhibitor, respectively. (****P < 0.0001).
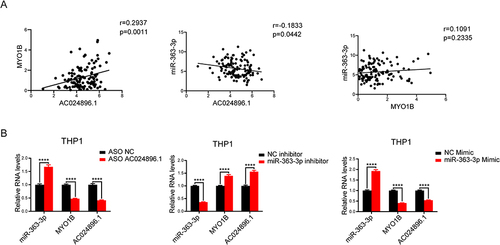
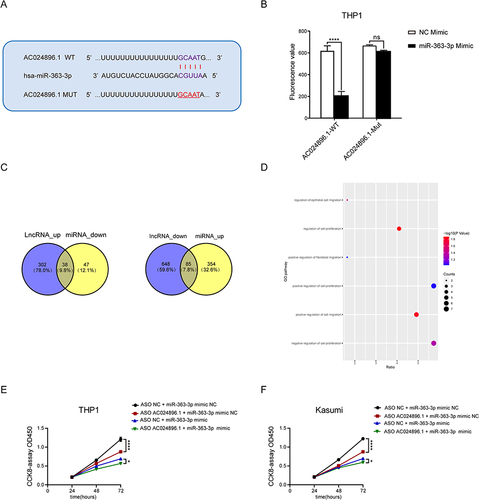
Figure 7 AC024896.1 as a ceRNA of miR-363-3p regulates MYO1B protein to affect the malignant progression of AML. (A) Bioinformatics analysis demonstrated that miR-363-3p directly targeted the AC024896.1 sequence. (B) Luciferase reporter plasmid containing AC024896.1-WT or AC024896.1-MUT was co-transfected into 293T cells with miR-363-3p mimic. (C) Venn diagram showed the overlapping genes of AC024896.1 groups and miR-363-3p groups. (D) Pathway enrichment of genes co-regulated by AC024896.1 and miR-363-3p. (E–F) The CCK-8 results of THP1 and Kasumi cells with knockdown AC024896.1 treated with NC mimic or miR-363-3p mimic. Data were expressed as the mean ± standard deviation of three independent experiments (n=3).(*P < 0.05, ****P < 0.0001).
Data Sharing Statement
The data that support the findings of this study are available from the corresponding author upon reasonable request.