
Figures & data
Figure 1 The detailed workflow chart analysis in our research.
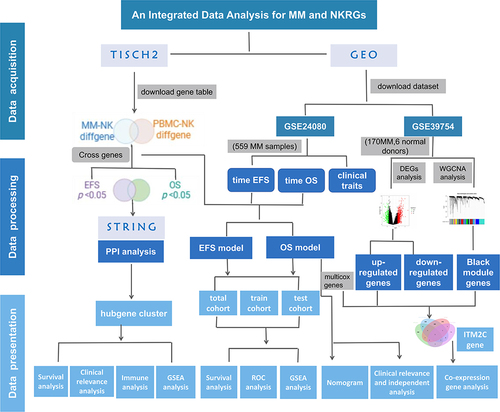
Figure 2 Identification of NK cells using scRNA–seq analysis in TISCH2 database. (A) Thirty–one clusters were identified in MM_GSE161801 dataset. (B) Nine cell types were defined in MM_GSE161801 dataset. (C) The pie chart of cell-type statistics in MM_GSE161801 dataset. (D) Twenty-six clusters were identified in PBMC_60K dataset. (E) Seven cell types were defined in PBMC_60K dataset. (F) The pie chart of cell-type statistics in PBMC_60K dataset. (G) The dot plot showed the relative expression levels of the marker genes in MM_GSE161801 cell type. (H) Venn diagram showing the 15 intersected cell types by the correlation and differential analysis.
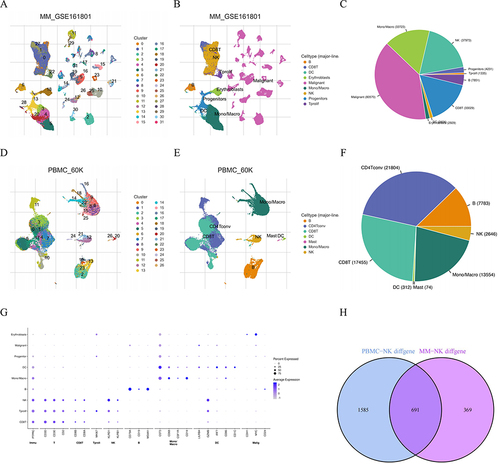
Figure 3 Identification of prognostic NK cell-related genes in MM. (A) The Venn plot of the intersection of OS-related genes and EFS-related genes. (B) The PPI network of the NK cell-related prognostic genes using STRING database. (C) The barplot diagram showing the degree of involvement of each key gene in the PPI network. (D) and (E) The gene co-expression analysis of the 32 key genes.
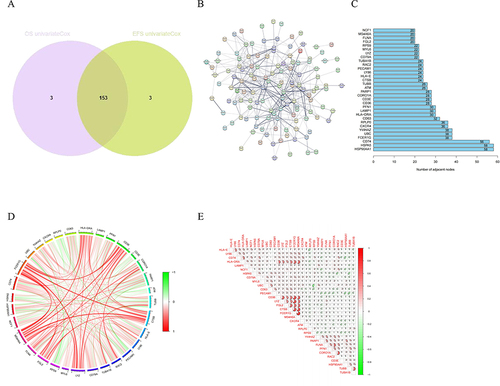
Figure 4 Identification of prognostic NK cell-related genes and consensus clustering. (A) Two NK subtypes of MM were recognized with prognostic NK cell-related genes using consensus clustering. (B) PCA, (C) tSNE and (D) UMAP plot showing the NK subtypes of MM. The survival curve of the patients in the two subgroups for (E) OS and (F) EFS. (G) Heatmap of distribution of clinicopathological variables and NK cell-related genes between different cluster groups. (H) The boxplot illustrating the difference in NK related-cell genes between two clusters. (I) The boxplot visualizing the distribution differences of immune cells between the two clusters.
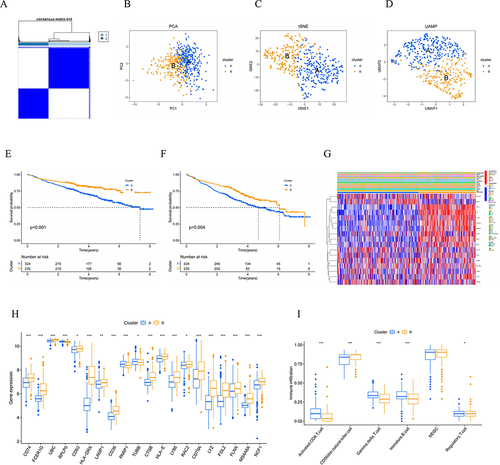
Figure 5 Construction of NK cell-related genes risk model in the MM cohort. LASSO regression and cross-validation for (A) OS group and (B) EFS group. (C, E and G) OS and (D, F and H) EFS: Kaplan–Meier curves analysis based on risk score, and ROC analysis for predicting the risk of death at 1, 3 and 5 years in MM patients in all cohort, training cohort and testing cohort.
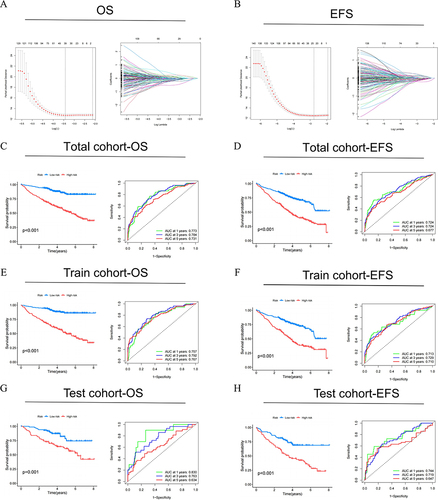
Figure 6 The heatmaps were plotted to show the expression level of (A) 16 genes from OS risk model and (B) 12 genes from EFS risk model in high- and low-risk groups. The boxplot for risk score of (C) OS and (D) EFS comparisons between A and B cluster subgroups. The Sankey diagram revealed the connection between cluster, risk score, and survival status for (E) OS group and (F) EFS group.
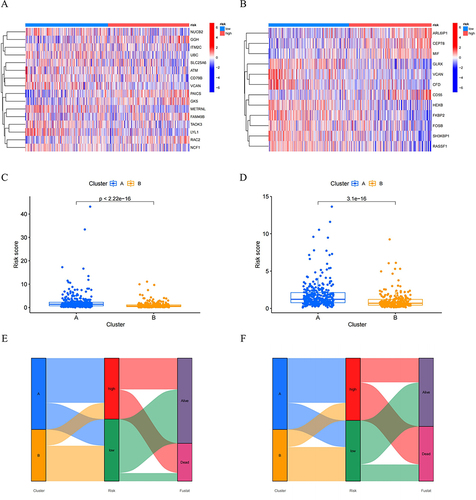
Figure 7 Clinical relevance analysis between high- and low-risk groups. (A) and (B) Correlation of NK risk score and clinicopathological characteristics based on the whole MM cohort. Expression of NKscore in different clinical factors in patients with MM patients. (C) Age; (D) Gender; (E) Race; (F) Isotype; (G) β2-MG; (H) CRP; (I) Creatinine; (J) LDH; (K) Albumin; (L) Haemoglobin; (M) BMPC; (N) Cytogenetics.
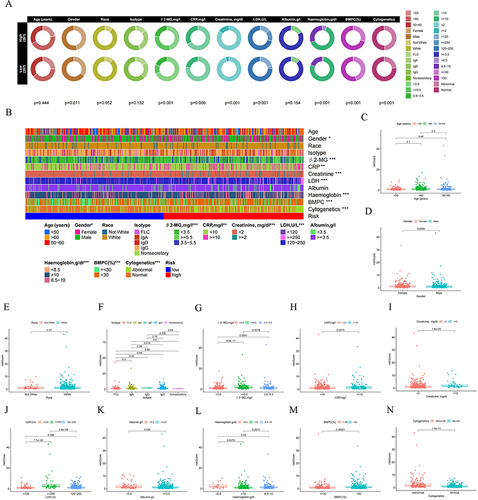
Figure 8 Independent prognostic value of NKscore and nomogram construction. (A) Univariate and (B) Multivariate analysis to identify independent prognostic risk factors for OS. (C) The established Nomogram integrating risk score and clinical features. (D, E and F) Calibration curves of the NKscore-integrated nomogram in 1-, 3-, and 5-year in the all cohort.
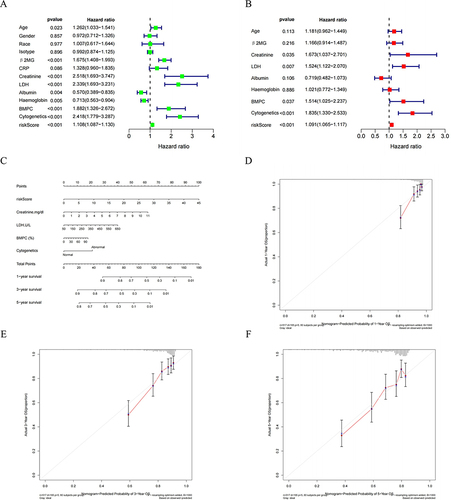
Figure 9 Identification of NK cell risk model genes in conjunction with WGCNA and DEGs. (A) Volcano plot and heatmap for DEGs in the MM and normal samples. Black: non DEGs in groups; red: upregulated DEGs in MM group; green: downregulated DEGs in in MM group. (B) Analysis of soft thresholds. (C) Gene dendrogram and module colors. (D) Module trait relationships. (E) The venn diagram of the DEGs, Black modules genes of WGCNA and NK risk model genes for OS.
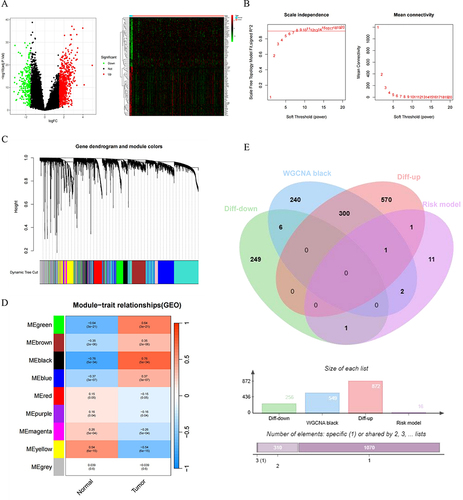
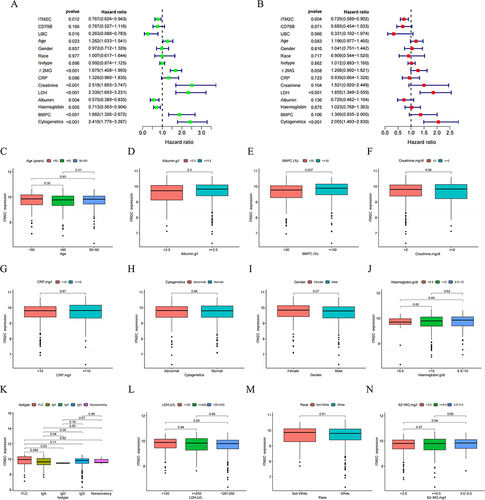
Figure 10 Expression of ITM2C in different clinical factors in patients with MM. (C) Age; (D) Gender; (E) Race; (F) Isotype; (G) β2-MG; (H) CRP; (I) Creatinine; (J) LDH; (I) Albumin; (K) Haemoglobin; (L) BMPC, (M) Albumin; (N) Haemoglobin.
Data Sharing Statement
The original data used to support the findings of this study are available in public databases that were included within this article.