
Figures & data
Figure 1 Spleen H&E.
Notes: (A) Low-power view of spleen showing a micronodular infiltrate with prominent white pulp expansion giving a biphasic appearance to the follicles. (B) Remnant of a germinal center involved by the neoplastic proliferation and effacement of the normal follicle mantle. (C) Biphasic pattern in detail showing a darker inner zone and a lighter external zone that merges with the red pulp. (D) High-power view showing small round lymphocytes with clumped chromatin and moderate amount of cytoplasm surrounding the germinal center and, in the outer zone (where proliferation takes place), medium-sized cells with clear and abundant cytoplasm admixed with scattered larger cells with large nuclei and prominent nucleoli. (E) Red pulp infiltration. (F) Involvement of red pulp sinuses and cords. (G) The red pulp has a variable cellular composition with medium-sized cells and scattered larger cells.
Abbreviation: H&E, hematoxylin and eosin.
Abbreviation: H&E, hematoxylin and eosin.
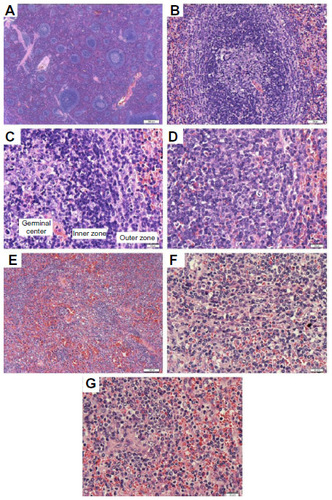
Figure 2 Bone marrow.
Note: CD20 staining highlights intrasinusoidal pattern of infiltration by the neoplastic cells.
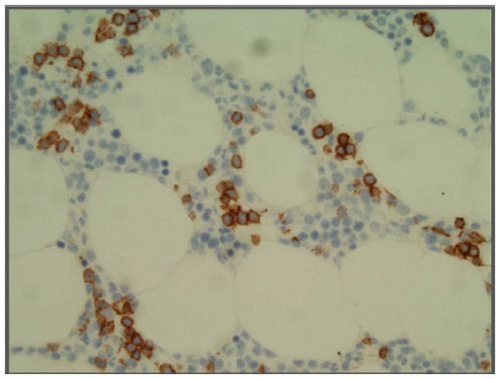
Figure 3 Spleen immunohistochemistry.
Notes: (A) and (B) Expression of CD20 by the neoplastic infiltrate. (C) IgD staining showing positive neoplastic cells. (D) Ki67/Mib-1 highlighting the higher proliferation indexes in the germinal center and outer zone (targetoid/biphasic pattern).
Abbreviation: IgD, immunoglobulin D.
Abbreviation: IgD, immunoglobulin D.
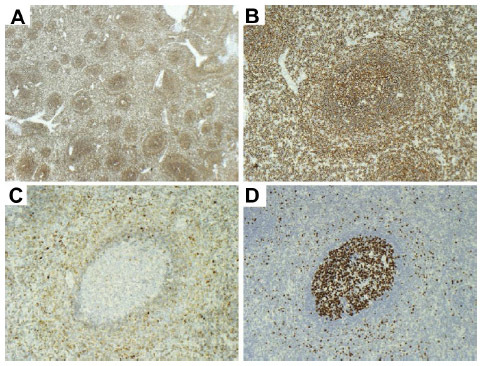
Table 1 SMZL diagnosis and staging
Table 2 SMZL risk stratification for a shorter cause-specific survival