
Figures & data
Table 1 Analytical methods and batches used to compare Eurofarma’s Fiprima® and Hoffman-La Roche Ltd Granulokine®
Figure 1 Total ion current chromatogram of mass spectromery (400–1,500 m/z) comparing Fiprima® (upper spectrum batch P037) and Granulokine® (lower pectrum batch B2070B05).
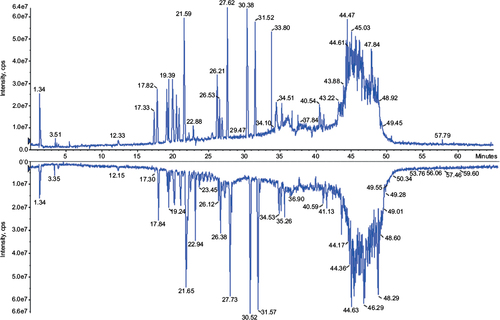
Figure 2 Comparison of far-UV CD spectra from Fiprima® and Granulokine®.
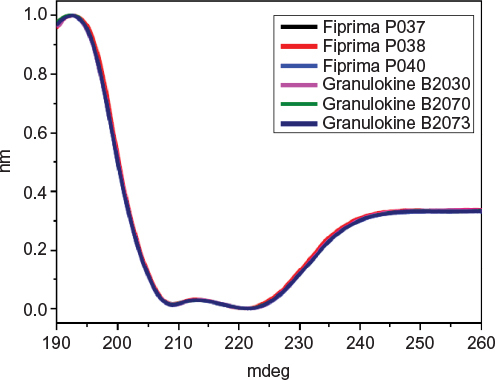
Table 2 Deconvolution using CDSSTR database
Figure 3 Far-UV CD spectra of samples submitted to different temperatures.
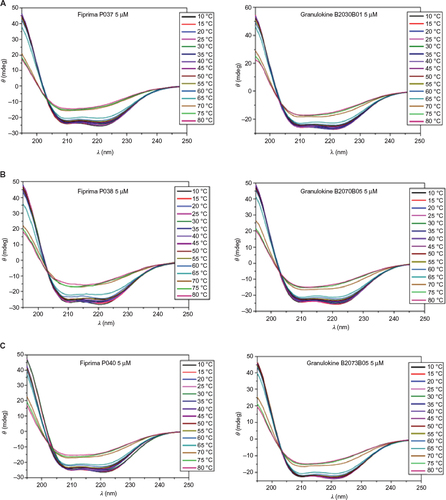
Figure 4 Near-UV CD nonnormalized spectra of samples of Eurofarma’s (P037, P038, P040) and Hoffman-La Roche Ltd batches (B2070B05, B2073B05).
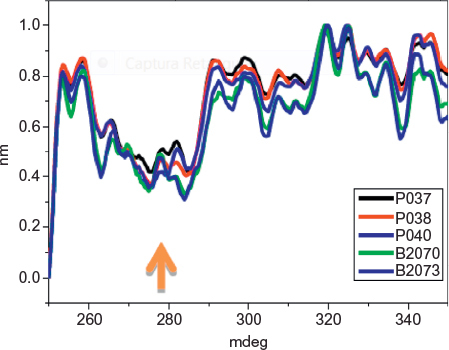
Figure 5 Comparison of fluorescence spectra of integral and denatured filgrastim.
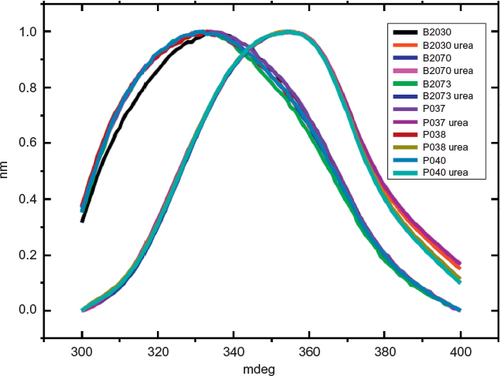
Figure 6 Comparison of tertiary structure of filgrastim.
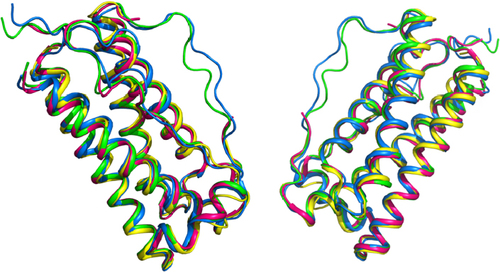
Figure 7 Electrophoresis (reduced SDS-PAGE) silver stained comparing Eurofarma batch P003 and Hoffman-La Roche Ltd batch B2010B02.
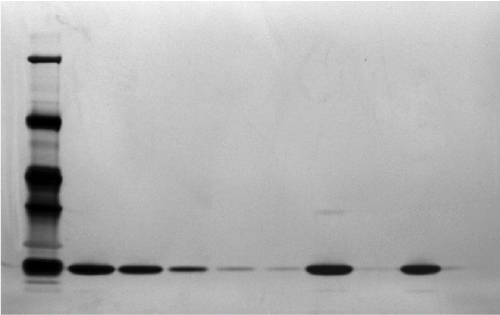
Figure 8 Comparative bidimensional electrophoresis.
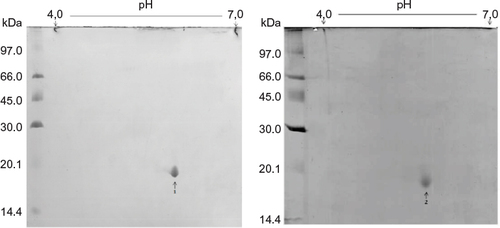
Figure 9 Spectra obtained of impurity peak (above) and the main filgrastim peak (below).
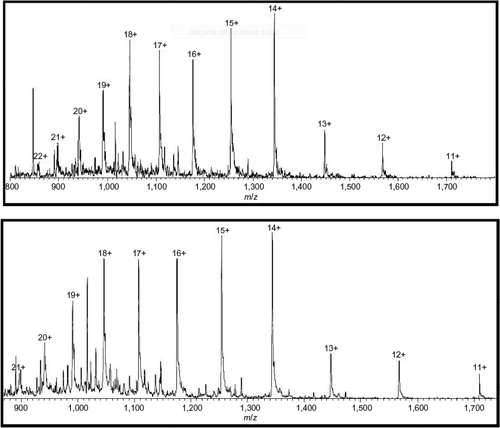
Figure 10 Comparative RP-HPLC.
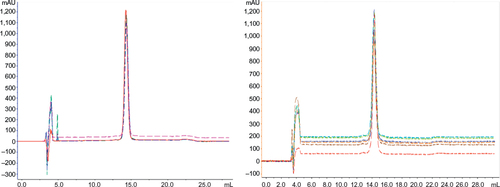
Table 3 Retention of the peaks from RP-HPLC and their area percentage
Figure 11 Comparative SE-HPLC.
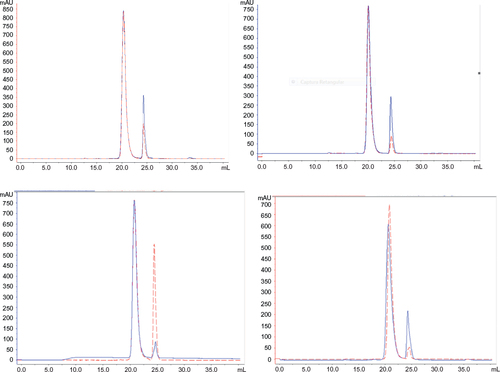
Table 4 Retention of the peaks from SE-HPLC and their area percentage
Figure 12 Comparative potency: Eurofarma’s batches in dark gray and Hoffman-La Roche Ltd batches in light gray.
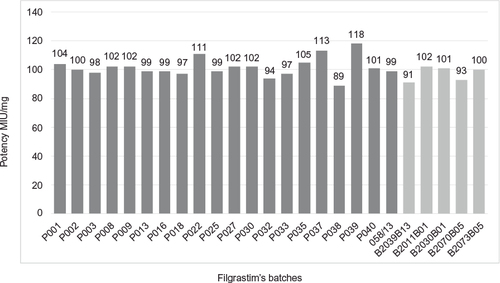
Figure 13 Zoom of SE-HPLC after intense agitation of filgrastim.
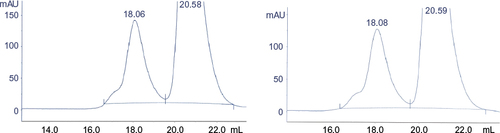
Table 5 Products behavior after being submitted to different stress conditions