Figures & data
Figure 1 Chromatographic fingerprint analysis and cell viability assay of Chinese herbal formula B401.
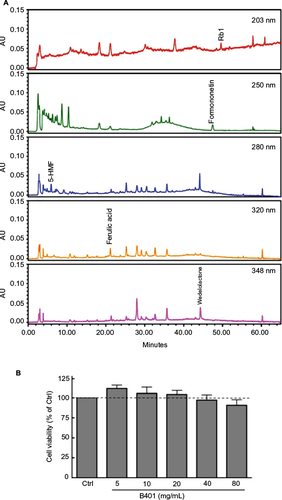
Figure 2 Motor coordination of Mn-treated mice was significantly enhanced under oral B401 treatment.
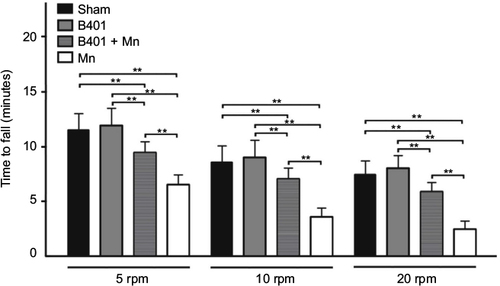
Figure 3 Expression levels of D1R and DA were increased significantly in the brain tissues of Mn-treated mice with oral B401 treatment.
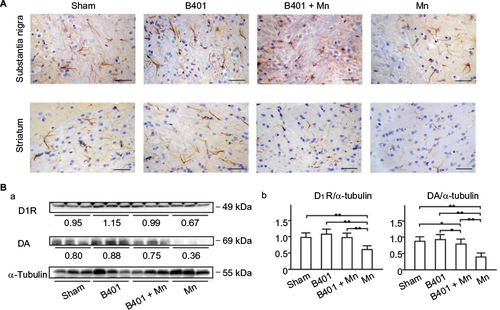
Figure 4 Expression levels of BDNF were increased significantly in the brain tissue of Mn-treated mice with oral B401 treatment.
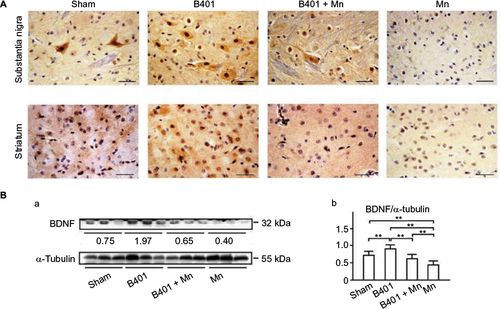
Figure 5 Expression levels of ROS were significantly decreased in the blood of Mn-treated mice under oral B401 treatment.
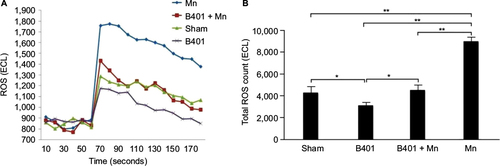
Figure 6 Expression levels of antioxidative stress-related SOD2 were increased significantly in the brain tissues of Mn-treated mice under oral B401 treatment.
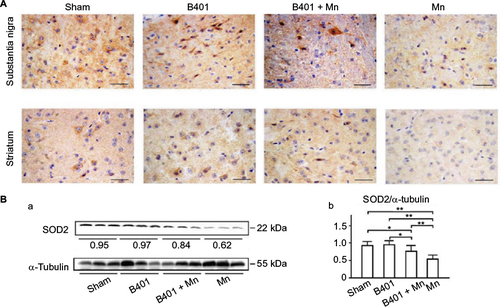
Figure 7 Expression levels of oxidative stress-related 3-NT were decreased significantly in the brain tissues of Mn-treated mice under oral B401 treatment.
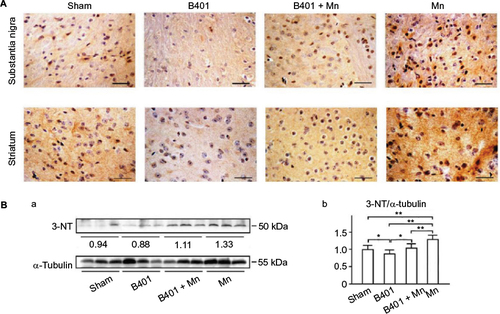
Figure 8 The ratio of antiapoptosis-related Bcl-2/BAX was increased significantly in the brain tissues of Mn-treated mice under oral B401 treatment.
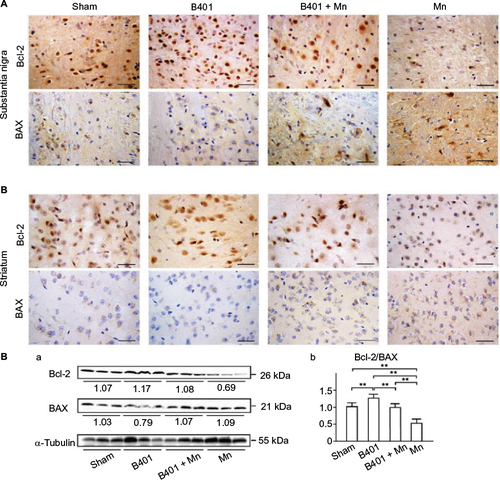
Figure 9 Expression levels of apoptosis-related Casp 3 were decreased significantly in the brain tissues of Mn-treated mice under oral B401 treatment.
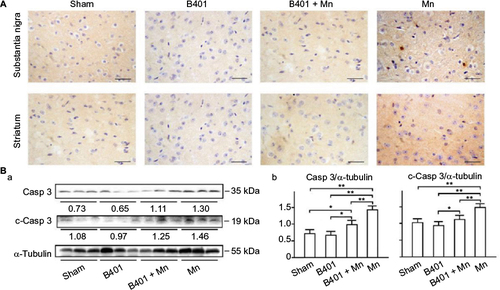
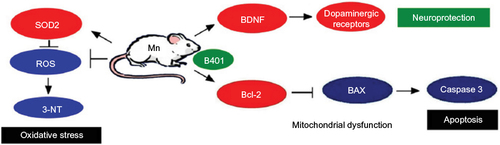
Figure 10 The schematic diagram illustrates the possible neuroprotective pathways of B401 treatment in the brain tissues of mice with Mn-induced neurotoxicity.