Figures & data
Figure 1 Fibroblasts were grown and challenged with either UV-A (uv subscript) or H2O2 (ox subscript) and cell viability and collagen I synthesis measured as described in Methods. Values are averages of triplicate assays and are expressed relative to control (=100). C=control untreated cells; N=20 ug/ml nephrilin peptide. *, **: p<0.05 and p<0.01 respectively, N versus C pairing; #, ##: p<0.05 and p<0.01 respectively, Cuv (or Cox) versus C pairing.
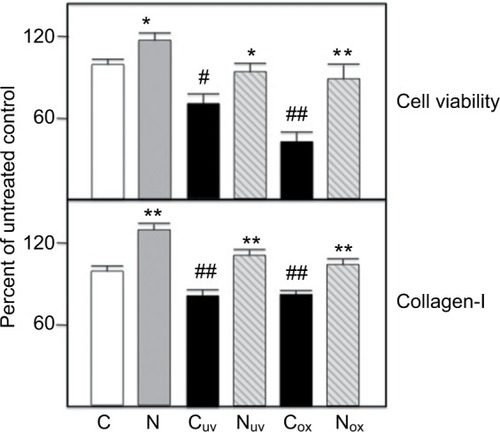
Figure 2 Renal PTECs were grown and challenged with H2O2 (ox subscript) ± nicotine (Nic) and ROS generation measured as described in Methods. Values are averages of triplicate assays. C=control untreated cells; N=10 ug/ml nephrilin peptide; S=10 ug/ml scrambled peptide. *, **: p<0.05 and p<0.01 respectively, N (or S) versus C pairing; # = p<0.05 Cox versus C.
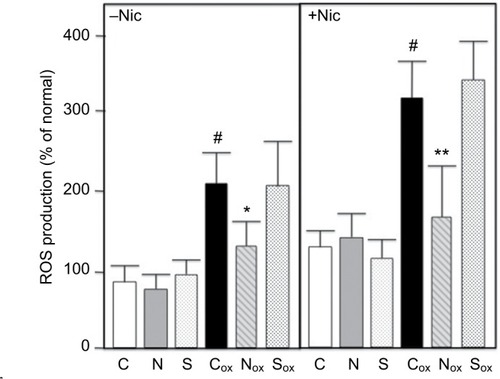
Figure 3 Pathway analysis using Ingenuity Systems software. Major network (score=32) is shown. Dataset was 3057 genes exhibiting differential expression in the Agilent RNA arrays (see text).
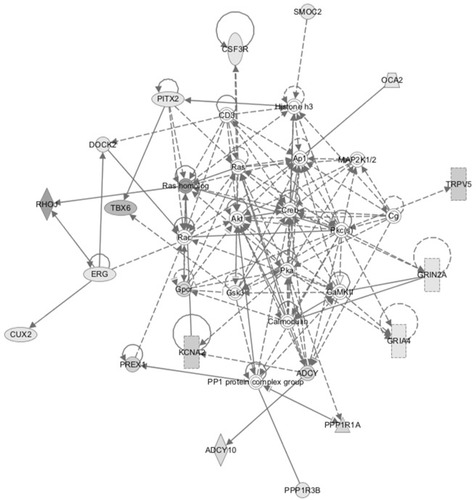
Table 1 RNA arrays. RNAs were extracted from cells and analyzed on Agilent Rat Gene Expression Microarrays 4×44K (AMDID 014879) as described in Methods. Of 41,105 genes interrogated 49 upregulated (>3-fold threshhold) genes of known function for which treatment with H2O2 alone was >30% over control and treatment with the Nic+ H2O2 combination elevated expression an additional >30% were identified.
Figure 4 Kidney tissue extracts were prepared and analyzed by ELISA as described in Methods. S=sham group; B=burn+saline; N1=burn+4mg/kg/day SQ nephrilin for 1 week post-burn. **p<0.01, N1 versus B; #, ##: p<0.05 and p<0.01, B versus S.
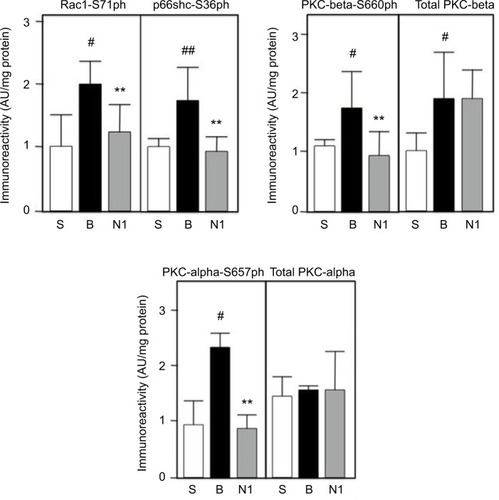
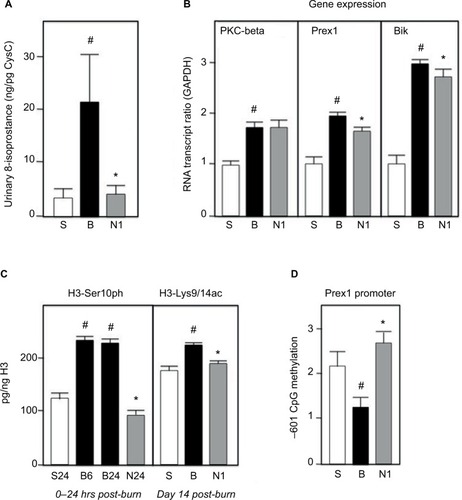
Figure 5 All extracts were prepared and assays performed as described in Methods. (A) Urine samples were assayed by ELISA and standardized against Cystatin C. (B) Gene transcripts were standardized versus GAPDH as standard. (C) Histone-3 phosphorylation and acetylation, as well as total histone-3, were determined by ELISA. Kidney tissues from 6 (B6=B group 6 hr) and 24 hours (S24, B24, N24) post-burn were assayed for phosphorylation, as early event. (D) CpG methylation is expressed in arbitrary units; each bar is an average of 4 animals. S=sham group; B=burn+saline; N1=burn+4mg/kg/day SQ nephrilin for 1 week post-burn. *p<0.05, N1 versus B; # p<0.05, B versus S.