Figures & data
Figure 1 Flowchart of the overall study.
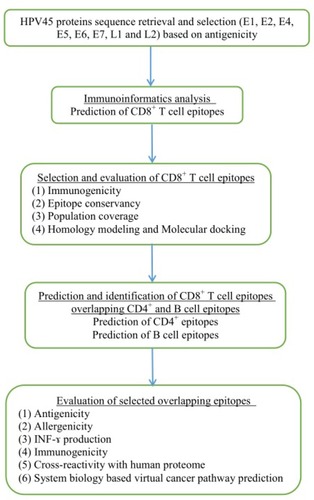
Table 1 CD8+ CTL epitopes prediction from HPV45 early and late antigenic proteins
Figure 2 Conservation across hrHPV strains by the CD8+ HPV45 immunogenic epitopes.
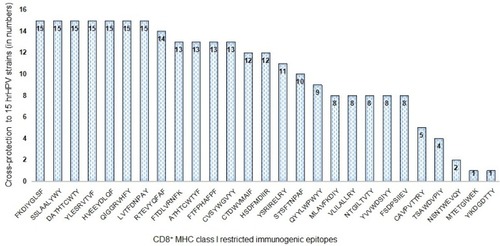
Figure 3 PC of the HPV45 epitopes based on the MHC class I restriction data.
Abbreviations: HLA, human leukocyte antigen; HPV, human papillomavirus; MHC, major histocompatibility complex; PC, population coverage.
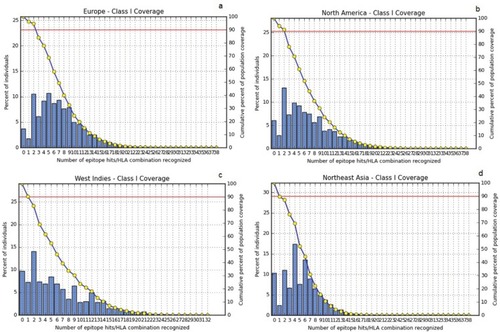
Table 2 Molecular docking interactions of CD8+ MHC class I-restricted epitopes
Table 3 CD8+ epitope sequences overlapped in CD4+ and B-cell epitope segments (indicated in bold)
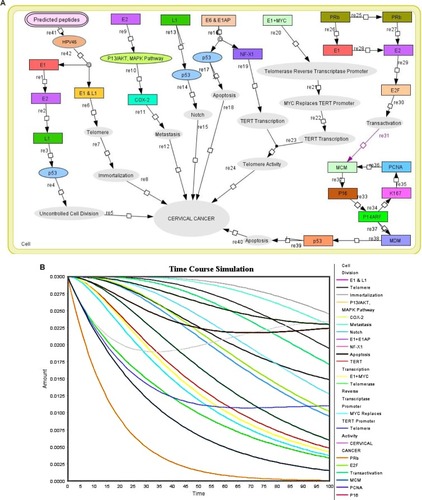
Figure 4 Biochemical pathway and pharmacokinetic studies on proposed peptides. (A) The panel represents the biochemical pathway of proposed peptides (μg) interaction with HPV45. (B) The graph represents the HPV45 time course simulation with proposed peptides (μg), where X axis represents the time and Y axis in left side represents the concentration and Y axis in right side indicates the entities which represent the molecules that interact with HPV45; peaks represent their biochemical activity during time course simulation.