Figures & data
Table 1 Demographic and clinical characteristics of patients with active RA before treatment with rituximab
Table 2 Clinical and laboratory parameters in patients with RA before and after treatment with rituximab
Figure 1 Scatter plot of vitamin D in patients with rheumatoid arthritis before and after treatment with rituximab.
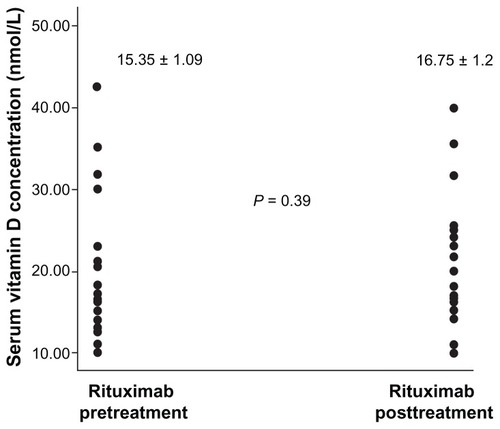
Table 3 Serum concentrations of vitamin D, IL-2, IL-6, IL-7, and IL-10 in patients with RA before and after treatment with rituximab
Table 4 Association among serum vitamin D concentration and serum ILs in patients with RA before treatment with rituximab