Figures & data
Table 1 Demographic and disease-related characteristics at start of documentation (baseline)
Figure 1 Change in mean disease activity score-28 values between endpoint and baseline in all patients and subgroups.
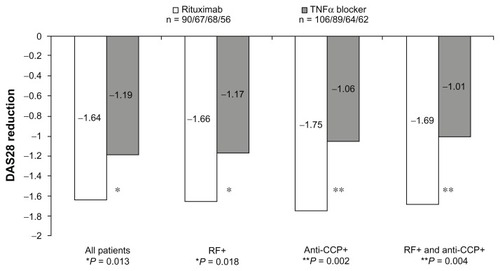
Table 2 Efficacy results depending on the first tumor necrosis factor-α inhibitor and seropositivity for rheumatoid factor and anti-cyclic citrullinated peptide: Disease Activity Score-28 change between baseline, 3 months, and 6 months
Figure 2 The mean absolute values of erythrocyte sedimentation rate, tender joint counts, swollen joint counts, and pain visual analog scale at baseline, 3 months posttreatment, and 6 months posttreatment.
Abbreviations: BL, baseline; ESR, erythrocyte sedimentation rate; M3, 3 months posttreatment; M6, 6 months posttreatment; SJC, swollen joint counts; TJC, tender joint counts; TNFα, tumor necrosis factor-α; VAS, visual analog scale.
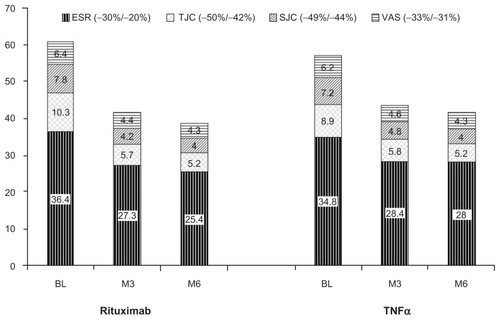
Table 3 Efficacy results: change from baseline to end of observation (196 patients)
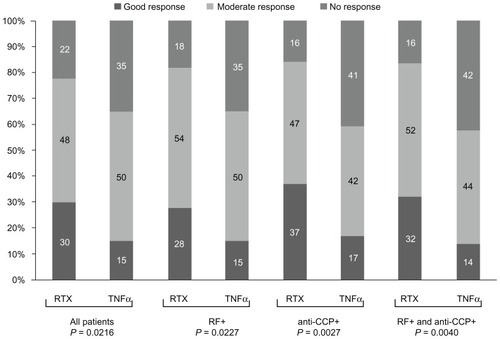
Figure 3 European league against Rheumatism response at observation endpoint in all groups.